Nine months of growth, and almost no profit left at the end of them
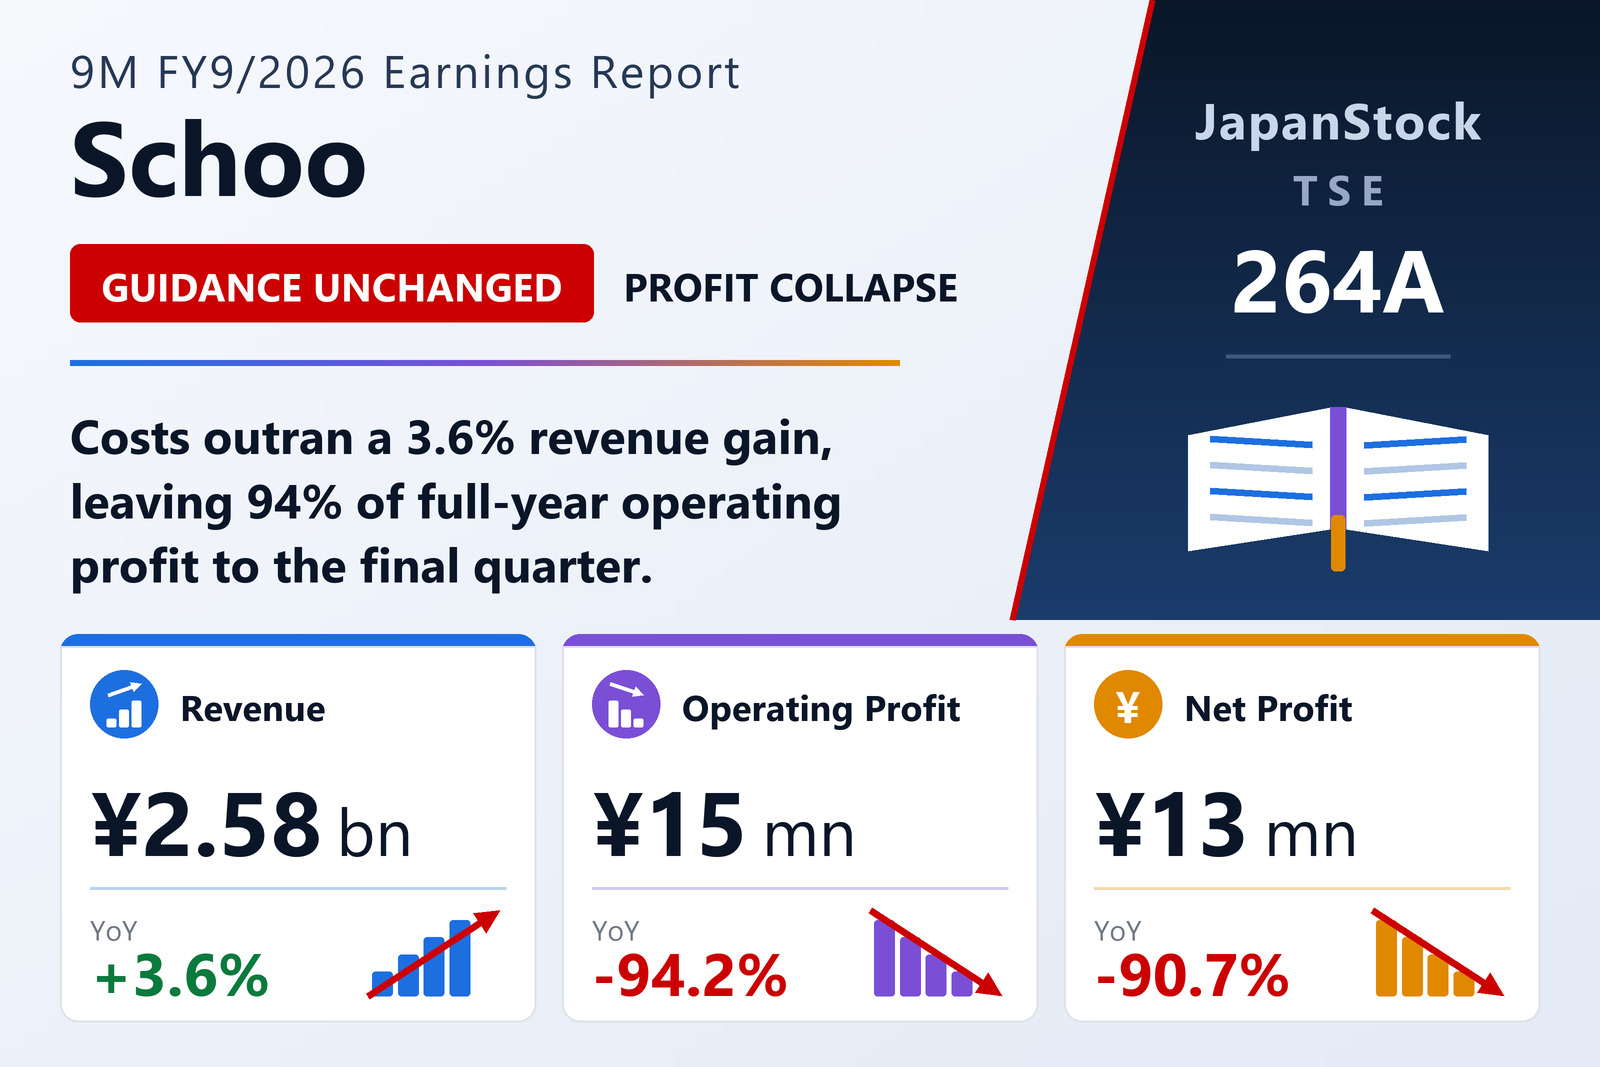
Schoo, Inc. (TSE Growth: 264A), the Tokyo online-learning company led by President Kenshiro Mori and built around the mission of "ridding the world of graduation" — the idea that learning should never come to an end — disclosed non-consolidated results for the first nine months of the year to September 2026 under Japanese GAAP on August 14, 2026. The period runs from October 1, 2025 to June 30, 2026. Revenue was ¥2,583 million, up 3.6%. Operating profit was ¥15 million, down 94.2%. Ordinary profit was ¥11 million, down 95.4%. Net profit was ¥13 million, down 90.7%. Basic earnings per share fell to ¥1.09 from ¥11.86, and diluted EPS to ¥1.04 from ¥11.04.
Two comparisons frame the quarter better than the percentages alone. The first is the growth rate itself: revenue rose 3.6% this year against 22.3% in the equivalent nine months of FY9/2025. Growth did not merely slow, it fell by roughly six-sevenths. The second is the absolute size of the profit line. Nine months of trading at a company with a ¥3.9 billion annual revenue target produced ¥15 million of operating profit — an operating margin of 0.6%, against 11.0% a year earlier. Schoo sells three products: Schoo for Business, its flagship corporate training service; Schoo for Personal, the individual learning subscription; and Schoo Swing, a learning-management platform sold to universities, other higher-education institutions and adult-education providers. It reports them as a single segment, the "adult learning business," and listed on the Tokyo Stock Exchange Growth market on October 22, 2024.
The margin did not go on cost of sales — it went on SG&A
The unusual feature of these results is that the gross line held up perfectly well. Cost of sales fell 1.0% to ¥619 million, so gross profit rose 5.2% to ¥1,964 million and the gross margin actually improved, to 76.0% from 74.9%. A company losing pricing power or absorbing delivery-cost inflation does not produce that shape.
Everything happened one line lower. Selling, general and administrative expenses rose 22.2% to ¥1,948 million, an increase of ¥354 million set against a gross-profit increase of only ¥96 million. The ¥258 million difference is, almost exactly, the fall in operating profit. As a share of revenue, SG&A moved from 63.9% to 75.4% in twelve months.
The company is candid about where the money went, though it does not quantify the individual buckets. It describes pursuing new-customer acquisition and expansion of existing accounts through aggressive marketing investment, strengthened lead-nurturing programmes, an expanded sales-agency partner network, improvements to the quality of learning content aimed at raising customer experience value, and a customer-facing model in which sales and customer success operate as one team. For large enterprises it combined its SaaS product with bespoke option services. It also began offering regional-revitalisation services, and it invested in hiring and developing staff and strengthening the organisation with future growth in mind. Depreciation and amortisation for the nine months tripled to ¥26 million from ¥9 million, consistent with the ¥34 million increase in capitalised software on the balance sheet — small in absolute terms, but a sign that content and platform investment is now flowing through the P&L as well as the cash flow.
Below the operating line the picture is quieter. Non-operating income of ¥6 million was more than offset by non-operating expenses of ¥10 million, of which interest expense was ¥10 million, giving ordinary profit of ¥11 million. An extraordinary gain of ¥5 million arrived from an unusual source: a short-swing profit disgorged by a major shareholder under Article 164(1) of the Financial Instruments and Exchange Act. After ¥2 million of tax, net profit was ¥13 million — a figure that, without that one-off, would have been materially smaller still.
The guidance gap: 94% of the operating-profit target sits in one quarter
Schoo left its full-year FY9/2026 forecast unchanged from the version published on November 14, 2025. It calls for revenue of ¥3,908 million (+16.3%), operating profit of ¥266 million (−8.3%), ordinary profit of ¥263 million (+1.9%), net profit of ¥223 million (+27.2%) and EPS of ¥18.05. Dividend guidance is ¥0.00, unchanged, as it was for FY9/2025.
Measured against those numbers after three quarters, the company has delivered 66.1% of the revenue target — behind a straight-line 75% pace, but within the range a back-loaded year can explain. The profit lines are a different matter: operating profit stands at roughly 6% of its full-year target, ordinary profit at about 4% and net profit at about 6%. What that leaves for the three months from July to September 2026 is revenue of about ¥1,325 million, operating profit of about ¥250 million, ordinary profit of about ¥252 million and net profit of about ¥210 million.
Put in rate terms, the fourth quarter has to bill 54% more than the nine months' quarterly average of ¥861 million and convert it at an operating margin of roughly 18.9%, against 0.6% for the nine months just reported. There is a further check available. Applying the guidance's own year-on-year percentages back to FY9/2025 implies full-year revenue of about ¥3,360 million and operating profit of about ¥290 million for that year — which, set against the ¥2,493 million and ¥274 million reported for its first nine months, implies a fourth quarter of roughly ¥867 million of revenue and ¥16 million of operating profit. On that arithmetic the fourth quarter was not a large profit quarter last year either. Guidance therefore asks the July–September period to grow revenue by about 53% year on year and to multiply its operating profit roughly fifteen-fold.
The tanshin does not attempt to bridge that gap. The section on forward-looking information says only that the forecast published on November 14, 2025 is unchanged, followed by the standard caution that actual results may differ. There is no phasing commentary and no seasonality explanation in the disclosure itself. Investors looking for one will have to go to the supplementary explanatory materials and the earnings video the company posted to its website on August 14, and to the individual-investor briefing scheduled for Monday, August 17, 2026. It is also worth noting that these quarterly financial statements were not subject to review by a certified public accountant or audit firm, and that no quarterly cash flow statement was prepared.
What the KPIs show — and what the disclosure leaves out
Schoo reports one segment but splits revenue into two categories. Services aimed at learners — overwhelmingly Schoo for Business, where the company concentrated on winning large-enterprise accounts — generated ¥2,511 million, up 3.3%, and accounted for 97.2% of revenue. Services aimed at teaching institutions — the Schoo Swing learning-management platform for universities and other higher-education bodies — generated ¥73 million, up 14.0%, or 2.8% of revenue. Swing is growing four times faster than the core, but from a base too small to move the total.
On the quality of that revenue, the company offers two data points and no numbers. It says average revenue per account (ARPA) improved as the large-enterprise push took hold, and that it maintained a low Net Revenue Churn Rate — which it defines as a revenue-based churn measure that nets off upsell and downsell within the existing customer base. Both are encouraging in direction. But the tanshin discloses no subscriber count, no corporate-customer count, and no ARR or MRR figure, so neither claim can be sized.
What can be inferred is uncomfortable. If ARPA is rising and revenue churn is low within a category that is 97% of the business, and that category still grew only 3.3%, then the contribution from newly won accounts must be modest — in a period when marketing spend, partner-network expansion and headcount all rose sharply. The company's own framing is that the adult-education market remains structurally strong, supported by corporate interest in labour-productivity gains, reskilling and human-capital management, and that demand for its online learning services should stay firm. The nine-month numbers do not contradict that view of the market. They do raise the question of how much it currently costs Schoo to capture a share of it.
Balance sheet: a buyback, a debt repayment and a smaller cash pile
Total assets fell to ¥3,010 million at June 30, 2026, down ¥432 million from ¥3,442 million at the September 30, 2025 year-end. The move was dominated by cash and deposits, down ¥579 million to ¥2,367 million, partly offset by increases in software (+¥34 million), prepaid expenses (+¥18 million) and other current assets (+¥20 million). Liabilities fell ¥357 million to ¥1,230 million, chiefly through a ¥150 million reduction in long-term borrowings, a ¥75 million fall in accounts payable and a ¥61 million fall in income taxes payable.
Net assets declined ¥75 million to ¥1,779 million. The largest single movement was the share buyback: following an extraordinary board resolution of December 17, 2025 the company acquired 250,000 of its own shares, and including purchases of odd-lot holdings treasury stock rose ¥138 million during the period to stand at ¥276 million at June 30. Treasury shares numbered 436,070 against 186,000 a year earlier. Partly offsetting that, exercises of stock acquisition rights added ¥24 million each to share capital and capital surplus, and shares issued rose to 12,712,350 from 12,534,780.
Because the balance sheet contracted faster than equity, the equity ratio improved to 59.1% from 53.9% — a stronger-looking ratio produced by a smaller company rather than by retained profit. Owners' equity of ¥1,779 million equals total net assets, so there are no non-controlling or subscription-rights components to strip out. No dividend was paid for FY9/2025, none has been declared at any quarter-end of FY9/2026, and the full-year forecast remains ¥0.00 — appropriate for a Growth-market company still funding an expansion, but it means the buyback is currently the only channel returning cash to shareholders.
| Metric | 9M FY9/2026 | 9M FY9/2025 | Change |
|---|---|---|---|
| Revenue (¥ million) | 2,583 | 2,493 | +3.6% |
| Gross profit (¥ million) | 1,964 | 1,868 | +5.2% |
| SG&A expenses (¥ million) | 1,948 | 1,594 | +22.2% |
| Operating profit (¥ million) | 15 | 273 | −94.2% |
| Operating margin | 0.6% | 11.0% | −10.4 pt |
| Ordinary profit (¥ million) | 11 | 243 | −95.4% |
| Net profit (¥ million) | 13 | 144 | −90.7% |
| Basic EPS (¥) | 1.09 | 11.86 | −90.8% |
| Diluted EPS (¥) | 1.04 | 11.04 | −90.6% |
| Dividend per share (¥) | 0.00 | 0.00 | — |
| Total assets (¥ million; vs Sep 30, 2025) | 3,010 | 3,442 | −12.5% |
| Net assets (¥ million; vs Sep 30, 2025) | 1,779 | 1,855 | −4.1% |
| Equity ratio (vs Sep 30, 2025) | 59.1% | 53.9% | +5.2 pt |
JapanStockPulse provides informational content only and does not constitute investment advice. Figures are taken from the company's published earnings short report and may be subject to subsequent revision.