Profit growth running ten points ahead of revenue growth
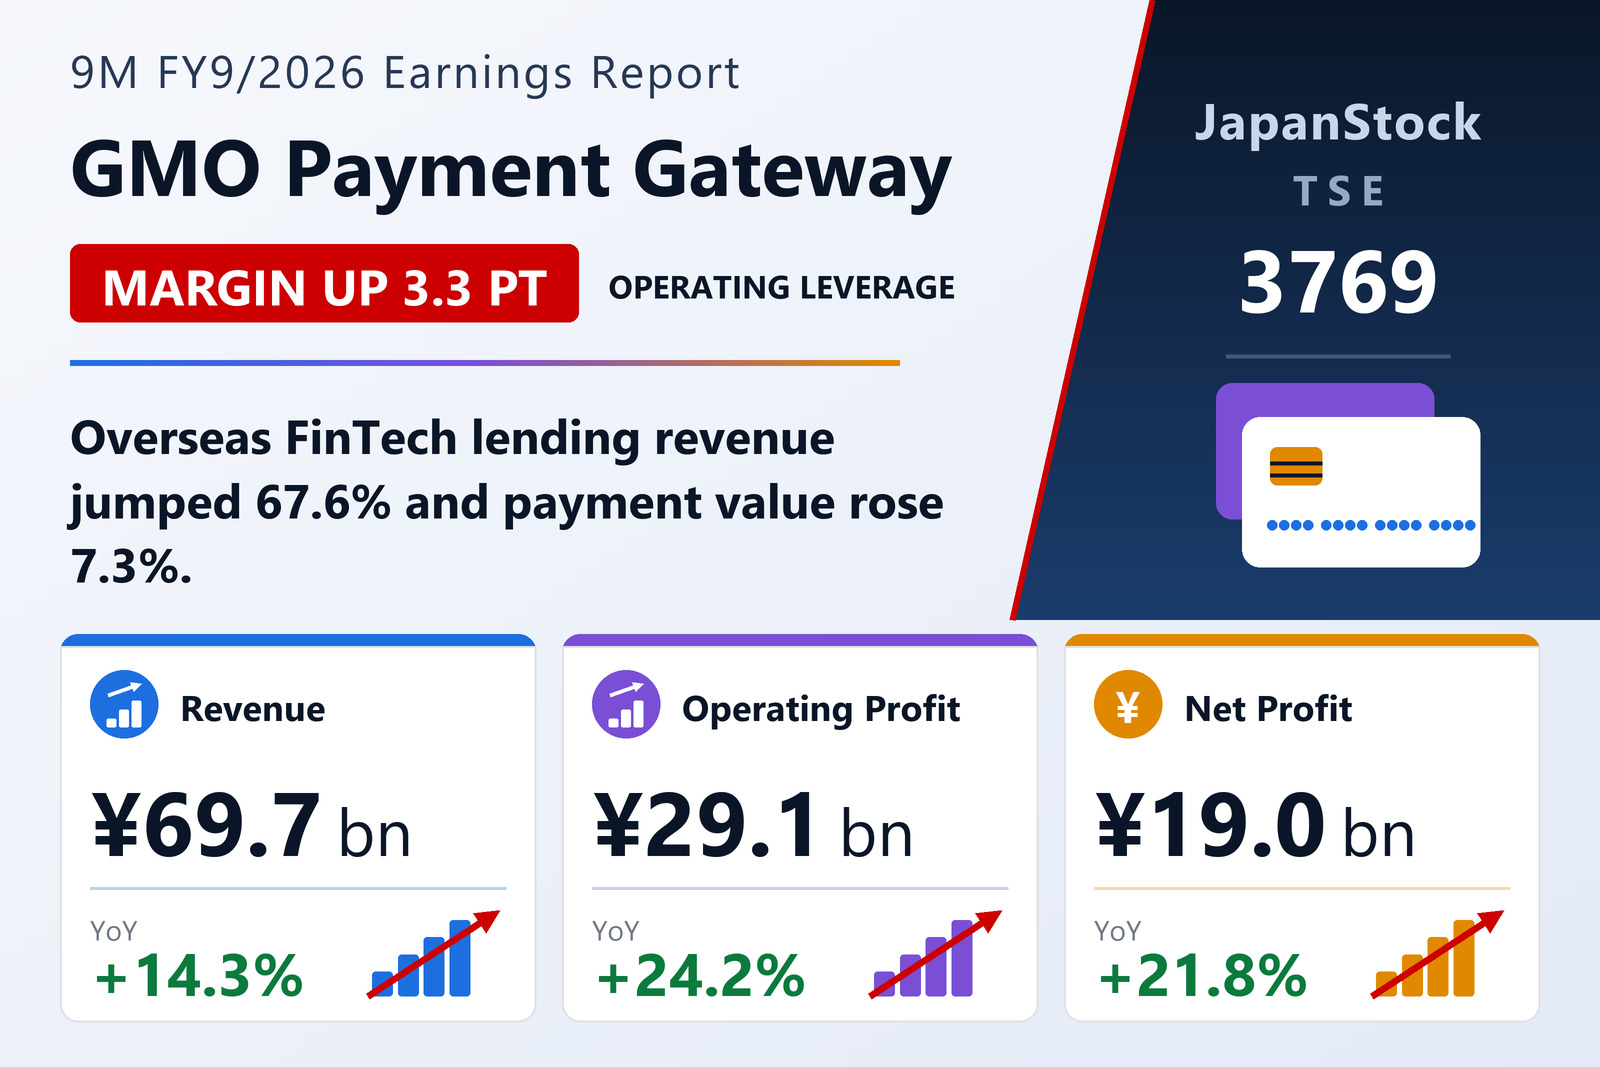
GMO Payment Gateway, Inc. (TSE: 3769), Japan's largest independent online payment processor, disclosed consolidated results for the first nine months of the fiscal year ending September 2026 — October 1, 2025 to June 30, 2026 — under IFRS on August 14, 2026. Revenue came in at ¥69,728 million, up 14.3% year on year from ¥61,002 million. Operating profit rose 24.2% to ¥29,112 million from ¥23,444 million, profit before tax rose 21.3% to ¥29,028 million, and profit for the period rose 22.1% to ¥19,694 million. Profit attributable to owners of parent was ¥18,981 million, up 21.8% from ¥15,587 million.
Per-share figures moved in line: basic earnings per share of ¥249.98 against ¥205.50 a year earlier, and diluted EPS of ¥247.27 against ¥203.15. Comprehensive income was the fastest-growing line on the statement, up 45.9% to ¥24,120 million from ¥16,528 million — but that jump belongs mostly to other comprehensive income of ¥4,425 million, of which ¥4,329 million came from the revaluation of financial assets measured at fair value through OCI rather than from trading performance. The interim figures carry a voluntary review conclusion from EY ShinNihon LLC.
The number that matters most here is the spread between the two headline growth rates. Revenue grew 14.3%; operating profit grew 24.2%. That produced an operating margin of 41.8%, up 3.3 percentage points from 38.4% in the same nine months a year earlier — evidence that the group's fixed cost base is being spread across a larger book of processing and lending business rather than scaling with it. One presentational change is worth noting for anyone comparing against older filings: from the first quarter of this year the company switched its reporting unit from thousands of yen to millions of yen, restating prior-period figures on the same basis.
Payment Processing carries the volume; Money Service Business carries the growth
The group reports three segments. Payment Processing — the core payment-agency business covering online billing, recurring billing and face-to-face acceptance — produced revenue of ¥51,837 million, up 13.7%, and segment profit of ¥26,114 million, up 17.8%. Money Service Business, the financial-services arm, produced revenue of ¥16,688 million, up 17.6%, and segment profit of ¥5,799 million, up 40.5%. Payment Enhancement, much the smallest, produced revenue of ¥1,388 million, up 3.9%, but segment profit of ¥335 million, down 4.2%. Unallocated corporate costs and intersegment eliminations of ¥3,135 million bridge the ¥32,248 million segment total to the ¥29,112 million reported operating profit.
Inside Payment Processing, the online and recurring-billing business ran into a headwind the company has flagged before: a specific large merchant brought its payment handling in house during the previous fiscal year. Despite that, GMO Payment Gateway's own online payment revenue still grew 10.7%, helped by steady payments in everyday categories such as food and beverage, travel and ticketing, and public money and utility bills. Subsidiary GMO Epsilon was the standout, with its "fincode byGMO" platform driving a 46.5% increase in processed payment value. The face-to-face business added initial revenue from continued terminal deliveries to large commercial facilities alongside solid merchant acquisition in the SME segment, while recurring-type revenue beat plan as large facilities moved into full operation and payment activity at everyday merchants kept climbing. BaaS support for financial institutions and corporates tracked the annual plan.
Money Service Business is where the profit growth was made. Deferred-payment services — "GMO Atobarai", the BtoB "GMO Kakebarai", and the "Atokara" BNPL service run jointly with Sumitomo Mitsui Card — added only 5.9% of revenue growth. The engine instead was lending to overseas FinTech operators, where revenue rose 67.6% on new borrowers and follow-on facilities concentrated in North America, India and Southeast Asia. Remittance services, the "Kyukyu byGMO" instant salary-receipt service and "Seikyusho Card Barai byGMO" invoice-card-payment service all grew transaction counts. The 40.5% jump in segment profit came from two disciplined sources rather than volume alone: uncollected rates in deferred payment held low and stable thanks to better credit-scoring accuracy and a strengthened collections operation, holding credit-related costs down, while the overseas lending book expanded without loosening credit quality.
Payment Enhancement is the one segment where profit fell. GMO Reserve Plus, which runs the medical-sector booking and reception platform "Medical Kakumei byGMO", grew revenue 32.0% as demand rose for smartphone-based booking, questionnaire entry, reception and payment, and for consolidating multiple clinics' patient cards into a single handset. That was offset by the marketing-support business, which is exposed to shifting conditions in the internet advertising market. Note also a boundary change: revenue from a security-enhancement service previously reported here has been recorded in Payment Processing from this quarter, because the substance of the transactions changed.
Fewer transactions, larger ones — and a revenue mix tilting toward spread
The operating metrics tell a more textured story than the revenue line alone. Across online billing, recurring billing, face-to-face and GMO Atobarai combined, the number of payment transactions processed fell 2.2% year on year, while the value of payments processed rose 7.3%. In other words the group is handling fewer, bigger transactions — the arithmetic signature of a large merchant taking its high-frequency volume in house while the remaining and newly acquired merchants skew toward larger tickets.
The company's own revenue-by-type disclosure lines up with that. Initial revenue (setup) rose 19.3% to ¥8,516 million and stock revenue (fixed monthly fees) rose 15.4% to ¥11,712 million — both driven by merchant additions rather than by usage. Fee revenue (per-transaction processing) was the slowest line at just 6.9%, to ¥19,677 million, consistent with the fall in transaction count. And spread revenue (merchant-value based) rose 17.8% to ¥29,820 million, the fastest of the four and now the single largest revenue type at roughly 43% of the total, consistent with rising payment value. The mix is shifting from a business paid per transaction to one paid on the money that moves across it.
That mix shift is a plausible part of the operating leverage story. Spread and stock revenue scale with value and merchant count rather than with the per-transaction infrastructure load, and the lending book scales with capital rather than headcount. Set against the risk: an in-housing event at one large merchant already cost the group a chunk of transaction count without visibly denting revenue growth, which suggests the exposure to any single merchant is manageable but not zero.
Guidance held, dividend forecast raised 18%
Full-year guidance for FY9/2026 was left unchanged from the previous release. The company continues to expect revenue of ¥93,235 million, up 13.0%, operating profit of ¥37,639 million, up 20.1%, profit before tax of ¥36,119 million, up 13.2%, profit for the year of ¥24,284 million, up 7.7%, and profit attributable to owners of parent of ¥23,406 million, up 7.2%, for basic EPS of ¥308.58.
Nine months in, the progress against those targets is well ahead of a straight-line pace. Revenue is at 74.8% of the full-year target, operating profit at 77.3%, profit before tax at 80.4% and attributable profit at 81.1%. Read backwards, the guidance implies a fourth quarter delivering only ¥8,527 million of operating profit against a nine-month run rate of roughly ¥9,704 million per quarter, and just ¥4,425 million of attributable profit against a nine-month average near ¥6,327 million. The company's language is that operating profit is "progressing steadily" against plan; the arithmetic says the remaining quarter is being guided conservatively, and that a full-year beat is the more likely direction of travel if the current trend holds.
On shareholder returns, the dividend forecast for FY9/2026 is ¥170.00 per share, paid entirely at year-end with no quarterly interim payments, against ¥144.00 for FY9/2025 — an increase of 18.1%, running ahead of the 7.2% attributable-profit growth the company guides to and implying a payout ratio of about 55% on forecast EPS. The forecast is unrevised from the prior announcement.
Balance sheet: a bigger book funded largely by float
Total assets stood at ¥429,773 million at June 30, 2026, up ¥22,973 million from ¥406,800 million at the September 2025 year-end. The composition moved more than the total: cash and cash equivalents fell ¥14,559 million, while trade and other receivables rose ¥11,714 million, advance payments rose ¥15,052 million, other receivables ¥2,594 million, inventories ¥1,331 million and other financial assets ¥5,780 million. Liabilities rose ¥10,458 million to ¥301,080 million, with ¥19,918 million of bonds redeemed and income taxes payable down ¥1,628 million, offset by deposits received up ¥21,886 million and borrowings up ¥10,642 million.
Equity rose ¥12,515 million to ¥128,692 million: profit of ¥19,694 million and other comprehensive income of ¥4,425 million against ¥10,921 million of dividends paid. Equity attributable to owners of parent reached ¥125,078 million from ¥113,013 million, and the owners' equity ratio improved to 29.1% from 27.8%. That ratio looks thin by general-industrial standards but is normal for a payment processor, whose balance sheet is inflated by merchant settlement funds held in transit — the ¥21,886 million increase in deposits received is exactly that float, and it is a funding source rather than leverage in the conventional sense.
Cash flow is the line that will draw the most questions. Operating cash flow fell to ¥13,893 million from ¥34,018 million a year earlier, not because earnings weakened but because working capital absorbed cash: advance payments up ¥15,052 million, trade and other receivables up ¥9,654 million, other receivables up ¥2,594 million and income taxes paid of ¥11,004 million, against pre-tax profit of ¥29,028 million, depreciation and amortization of ¥3,178 million and a ¥21,882 million increase in deposits received. Investing outflows of ¥8,568 million covered ¥2,843 million of intangible-asset purchases and ¥5,194 million of investment securities. Financing used ¥21,378 million, chiefly the ¥20,000 million bond redemption and ¥10,916 million of dividends against ¥10,000 million of new long-term borrowing. Cash and equivalents closed the period at ¥205,480 million. An analyst and institutional-investor briefing was scheduled for the disclosure date, August 14, 2026.
| Metric | 9M FY9/2026 | 9M FY9/2025 | Change |
|---|---|---|---|
| Revenue (¥ million) | 69,728 | 61,002 | +14.3% |
| Operating profit (¥ million) | 29,112 | 23,444 | +24.2% |
| Operating margin | 41.8% | 38.4% | +3.3 pt |
| Profit before tax (¥ million) | 29,028 | 23,938 | +21.3% |
| Profit for the period (¥ million) | 19,694 | 16,135 | +22.1% |
| Profit attrib. to owners of parent (¥ million) | 18,981 | 15,587 | +21.8% |
| Comprehensive income (¥ million) | 24,120 | 16,528 | +45.9% |
| Basic EPS (¥) | 249.98 | 205.50 | +21.6% |
| Payment Processing revenue (¥ million) | 51,837 | 45,575 | +13.7% |
| Money Service Business revenue (¥ million) | 16,688 | 14,191 | +17.6% |
| Payment Enhancement revenue (¥ million) | 1,388 | 1,336 | +3.9% |
| Total assets (¥ million; vs Sep 30, 2025) | 429,773 | 406,800 | +5.6% |
| Equity attrib. to owners of parent (¥ million; vs Sep 30, 2025) | 125,078 | 113,013 | +10.7% |
| Owners' equity ratio (vs Sep 30, 2025) | 29.1% | 27.8% | +1.3 pt |
JapanStockPulse provides informational content only and does not constitute investment advice. Figures are taken from the company's published earnings short report and may be subject to subsequent revision.