A ¥120 billion swing on the operating line
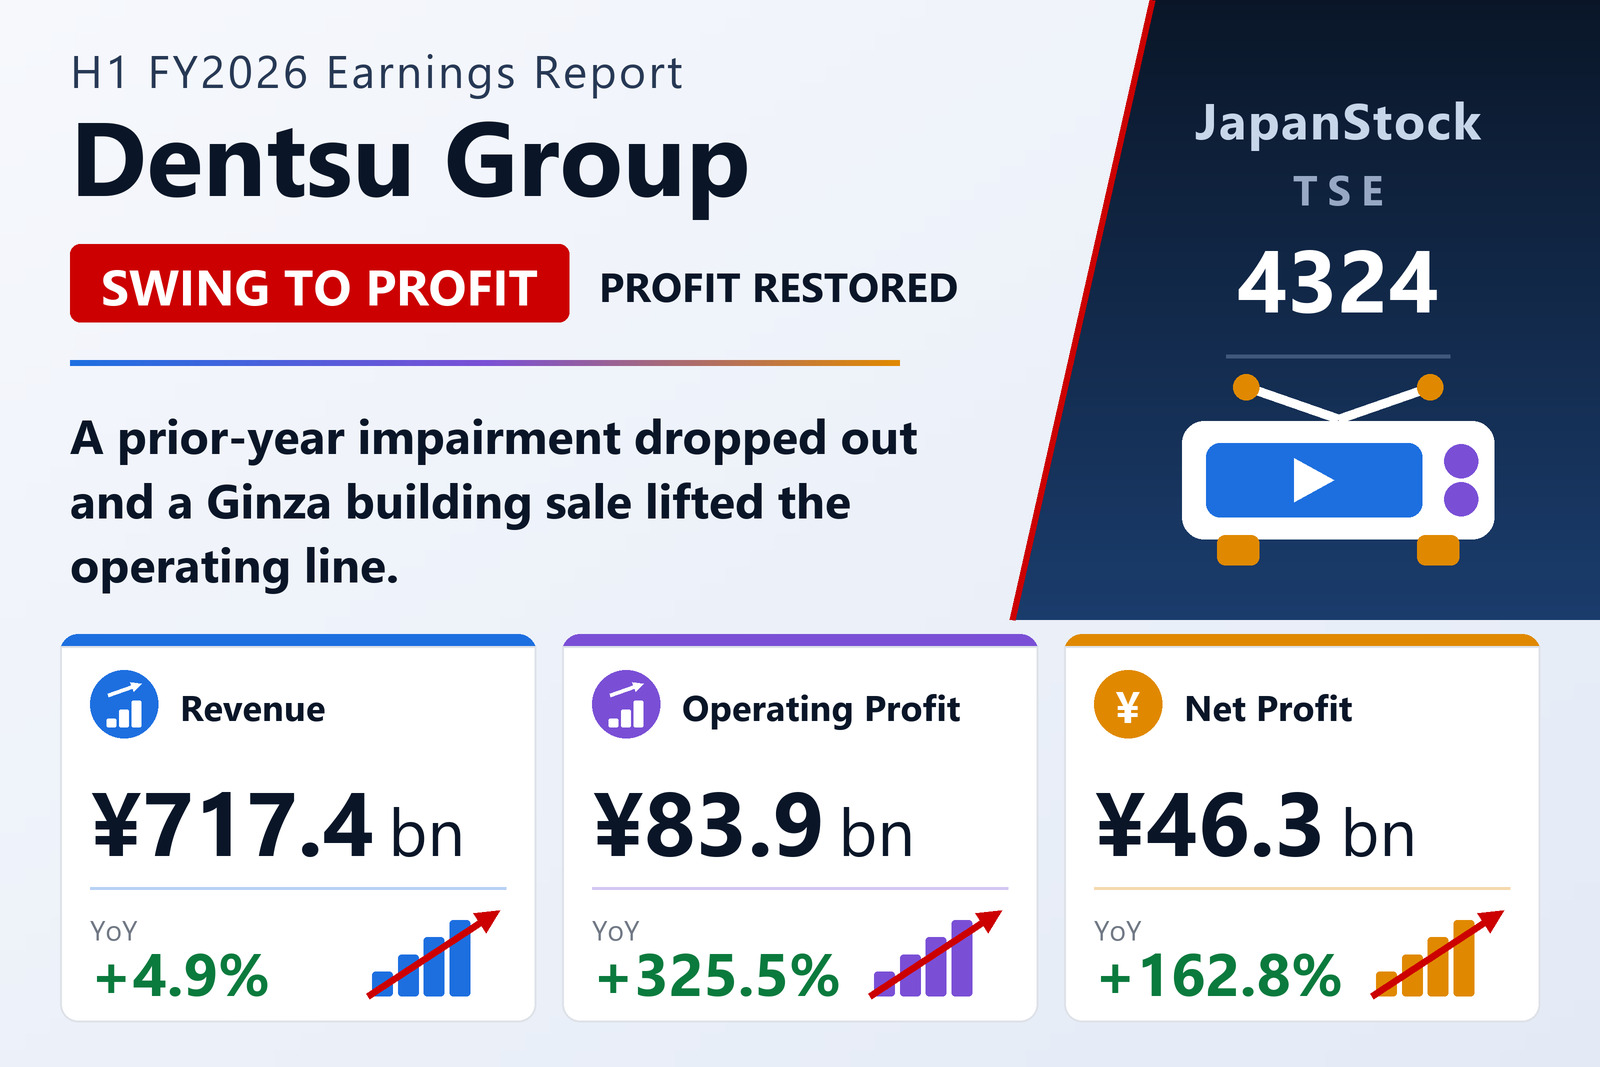
Dentsu Group Inc. (TSE: 4324), the Tokyo-listed advertising and marketing group led by President and Global CEO Takeshi Sano, disclosed consolidated results for the first half of the year to December 2026 — January 1 to June 30, 2026 — under IFRS on August 14, 2026. Revenue rose 4.9% to ¥717.4 billion, and net revenue — the gross-profit line Dentsu manages the business against and the denominator of its operating margin — rose 3.7% to ¥583.1 billion. Below that, the character of the accounts changes entirely. Operating profit came in at ¥83.9 billion against an operating loss of ¥36.5 billion a year earlier; profit before tax at ¥77.5 billion against a ¥43.4 billion loss; profit for the period at ¥51.5 billion against a ¥69.3 billion loss; and profit attributable to owners of the parent at ¥46.3 billion against a ¥73.6 billion loss. Basic earnings per share were ¥178.27, versus minus ¥283.72 a year earlier, with diluted EPS of ¥177.58. Comprehensive income of ¥56.0 billion compares with a comprehensive loss of ¥94.8 billion.
The ¥120.4 billion swing on the operating line is overwhelmingly a story about what is no longer there. In the first half of 2025, judging that deteriorating economic conditions in the Americas and EMEA indicated possible impairment, Dentsu tested the goodwill allocated to the cash-generating unit groups in those two regions and wrote down ¥68,858 million of Americas goodwill and ¥17,094 million of EMEA goodwill, part of an ¥86.6 billion impairment charge for the half. This year that line is empty — the tanshin records no impairment at all. Pushing in the group's favour, meanwhile, the first quarter carried the gain on the sale of the Dentsu Ginza Building, which appears as ¥29.6 billion of net gains on the sale and disposal of fixed assets in the income statement and ¥31.0 billion of proceeds in investing cash flow. That item grew material enough this period that Dentsu promoted it out of "other expenses" into its own line and restated the prior-year comparative to match.
Why adjusted operating profit rose only 6.6%
Strip both of those out and a much quieter picture emerges. Adjusted operating profit — Dentsu's own headline measure, defined as operating profit excluding acquisition-related gains and losses and one-off items — rose 6.6% to ¥71,982 million, and the operating margin improved 30 basis points to 12.3% from 12.0%. Adjusted profit attributable to owners of the parent, which additionally excludes fair-value movements on contingent consideration (earn-out liabilities) and on share-purchase obligations from acquisitions, together with the related tax and minority effects, rose 17.9% to ¥38,234 million for adjusted EPS of ¥147.29 against ¥124.98. That 17.9% is the cleanest read on the half.
The bridge between the two operating figures runs in both directions. Adding back to reported operating profit come ¥12.3 billion of amortisation of intangibles arising on acquisitions and ¥12.4 billion of restructuring costs — the latter nearly triple the ¥4.4 billion booked a year earlier, and the cash cost of the management-base rebuild now under way. Coming out are the ¥29.6 billion fixed-asset disposal gain and roughly ¥7.1 billion of other one-off income. In other words, the same programme that flatters this year's reported profit through an asset sale is also charging the group a rising restructuring bill, and the adjusted line is where the two are netted away.
One further figure deserves attention because it frames everything below it: organic growth in net revenue was just 0.3% for the group. The 3.7% reported increase is therefore very largely a currency effect, with the yen weaker against the dollar, sterling, the euro and a range of Asian currencies through the period. Management attributes the improvement in adjusted operating profit not to demand but to cost control — including the first partial benefits of the cost savings from rebuilding the management base — and the world it describes is one of prolonged geopolitical instability and continuing price pressure rather than recovery.
Japan carries the group; the Americas give ground
Japan, Dentsu's largest and by some distance its most profitable region, delivered organic net revenue growth of 5.0%, with marketing — internet and television advertising — alongside digital transformation, business transformation and sports and entertainment all growing. Reported net revenue nonetheless slipped 0.3% to ¥235.9 billion, because CARTA HOLDINGS became an equity-method affiliate in January 2026 and its results had been consolidated in the prior-year half. Lower SG&A carried adjusted operating profit up 3.6% to ¥60.4 billion, a record for a first half, and the operating margin to 25.6% from 24.6%. Excluding the CARTA effect, the company notes, net revenue would also have exceeded the record set in the first half of 2025.
The Americas is the region doing the damage. Organic net revenue growth was minus 5.0%, with the United States — the region's principal market — in negative territory. A weaker yen against the dollar lifted reported net revenue 1.5% to ¥156.1 billion, but underlying decline drove adjusted operating profit down 11.8% to ¥29.4 billion and compressed the operating margin to 18.8% from 21.7% — a loss of 2.9 percentage points in the region that carried last year's largest goodwill write-off.
EMEA is the mirror image: organic growth of minus 0.2%, with Germany, Italy and Switzerland negative and the UK, Spain and Poland positive, yet a sharp profit recovery. Currency translation lifted reported net revenue 13.7% to ¥138.0 billion, and despite a decline excluding currency, SG&A restraint — again including part of the savings from the management-base rebuild — more than doubled adjusted operating profit to ¥12.1 billion, up 113.1%, taking the margin to 8.8% from 4.7%. In APAC (Asia-Pacific excluding Japan) organic growth was minus 3.8%, with Australia, China and Taiwan negative and India positive; reported net revenue rose 5.1% to ¥49.6 billion on currency, and the region narrowed its adjusted operating loss to ¥3.2 billion from ¥4.2 billion, improving the margin to minus 6.5% from minus 8.9%. Corporate costs and eliminations absorbed ¥26.8 billion of adjusted operating profit, up from ¥25.7 billion.
Balance sheet and cash: the equity ratio climbs to 13.8%
Total assets fell to ¥3,066.2 billion at June 30 from ¥3,206.8 billion at December 31, 2025, a decline of ¥140.6 billion or 4.4%, driven mainly by a ¥213.7 billion reduction in trade and other receivables that reflects the normal working-capital rhythm of a media buying business. Total equity rose to ¥485.7 billion from ¥448.0 billion, and equity attributable to owners of the parent to ¥424.6 billion from ¥374.8 billion — a 13.3% increase. With a smaller balance sheet and a larger equity base, the owners' equity ratio improved to 13.8% from 11.7%, a gain of 2.1 percentage points, and book value per share rose to ¥1,635.72 from ¥1,444.02. That ratio remains structurally low by the standards of most listed Japanese companies, but it is a genuine repair after a year in which impairment charges consumed capital.
Cash generation improved materially. Operating cash flow was ¥95.1 billion, against ¥37.0 billion in the prior-year half, helped both by higher pre-tax profit and by a ¥44.7 billion working-capital inflow that reversed a ¥24.4 billion outflow a year earlier. Investing activities produced a net inflow of ¥12.2 billion, with ¥31.0 billion of proceeds from the fixed-asset sale outweighing ¥14.1 billion spent on acquiring subsidiaries and ¥8.5 billion of capital expenditure. Financing consumed ¥55.6 billion, including ¥17.9 billion of lease repayments, ¥16.0 billion of long-term debt repayment and ¥11.6 billion of purchases of subsidiary interests from non-controlling shareholders. Cash and equivalents ended the half at ¥366.4 billion, up from ¥295.2 billion at the year-end.
Guidance untouched, and what the second half has to carry
Dentsu left its full-year forecast for the year to December 2026 exactly where it stood at the February 13 disclosure. It guides to revenue of ¥1,491.5 billion, up 3.9%, net revenue of ¥1,230.2 billion, up 2.7%, adjusted operating profit of ¥166.3 billion, down 3.6%, operating profit of ¥152.6 billion, profit for the year of ¥78.7 billion, adjusted profit attributable to owners of ¥85.2 billion, down 8.9%, and profit attributable to owners of ¥69.7 billion, for adjusted EPS of ¥328.21 and basic EPS of ¥268.50. On the operating margin the company declines to give a point figure at all, stating a target of "in the 13% range" on the explicit reasoning that in an opaque business environment a range is the appropriate way to express its most important KPI — an unusual and, in the circumstances, candid piece of disclosure.
Set the half against those numbers and the second half looks demanding. Revenue is 48.1% of the full-year target and net revenue 47.4%, both close to a straight-line pace. But adjusted operating profit is only 43.3% of its target and adjusted profit attributable to owners 44.9%, while the reported lines are far ahead — operating profit at 55.0% and profit attributable to owners at 66.4% of target, precisely because the Ginza gain sits in the first half and will not repeat. Held to its own guidance, Dentsu is implying roughly ¥94.3 billion of adjusted operating profit in the second half, around a tenth below the roughly ¥105 billion the group earned in the second half of 2025; on adjusted profit attributable to owners the implied second-half decline is steeper still, of the order of 20%. Management is guiding, in short, to a weaker second half than the first-half growth rate would suggest.
The tanshin reports no material subsequent events, no change in the scope of consolidation and no change in accounting policies beyond the presentational reclassification of fixed-asset disposal gains described above. As is standard for a Japanese interim release, the figures have not been subject to audit or review by a certified public accountant. Dentsu filed its half-year report on August 14, 2026 and is holding an earnings briefing for institutional investors and analysts, with supplementary explanatory materials published alongside the release.
| Metric | H1 FY12/2026 | H1 FY12/2025 | Change |
|---|---|---|---|
| Revenue (¥ million) | 717,352 | 683,904 | +4.9% |
| Net revenue / gross profit (¥ million) | 583,068 | 561,994 | +3.7% |
| Adjusted operating profit (¥ million) | 71,982 | 67,526 | +6.6% |
| Operating margin | 12.3% | 12.0% | +30 bp |
| Operating profit / (loss) (¥ million) | 83,869 | −36,545 | Swing to profit |
| Profit / (loss) before tax (¥ million) | 77,459 | −43,375 | Swing to profit |
| Profit / (loss) for the period (¥ million) | 51,530 | −69,309 | Swing to profit |
| Adjusted profit attrib. to owners (¥ million) | 38,234 | 32,442 | +17.9% |
| Profit / (loss) attrib. to owners of parent (¥ million) | 46,277 | −73,647 | Swing to profit |
| Comprehensive income / (loss) (¥ million) | 55,973 | −94,847 | Swing to profit |
| Basic EPS (¥) | 178.27 | −283.72 | Swing to profit |
| Adjusted EPS (¥) | 147.29 | 124.98 | +17.9% |
| Total assets (¥ million; vs Dec 31, 2025) | 3,066,158 | 3,206,787 | −4.4% |
| Equity attrib. to owners (¥ million; vs Dec 31, 2025) | 424,611 | 374,849 | +13.3% |
| Owners' equity ratio (vs Dec 31, 2025) | 13.8% | 11.7% | +2.1 pt |
| Book value per share (¥; vs Dec 31, 2025) | 1,635.72 | 1,444.02 | +13.3% |
JapanStockPulse provides informational content only and does not constitute investment advice. Figures are taken from the company's published earnings short report and may be subject to subsequent revision.