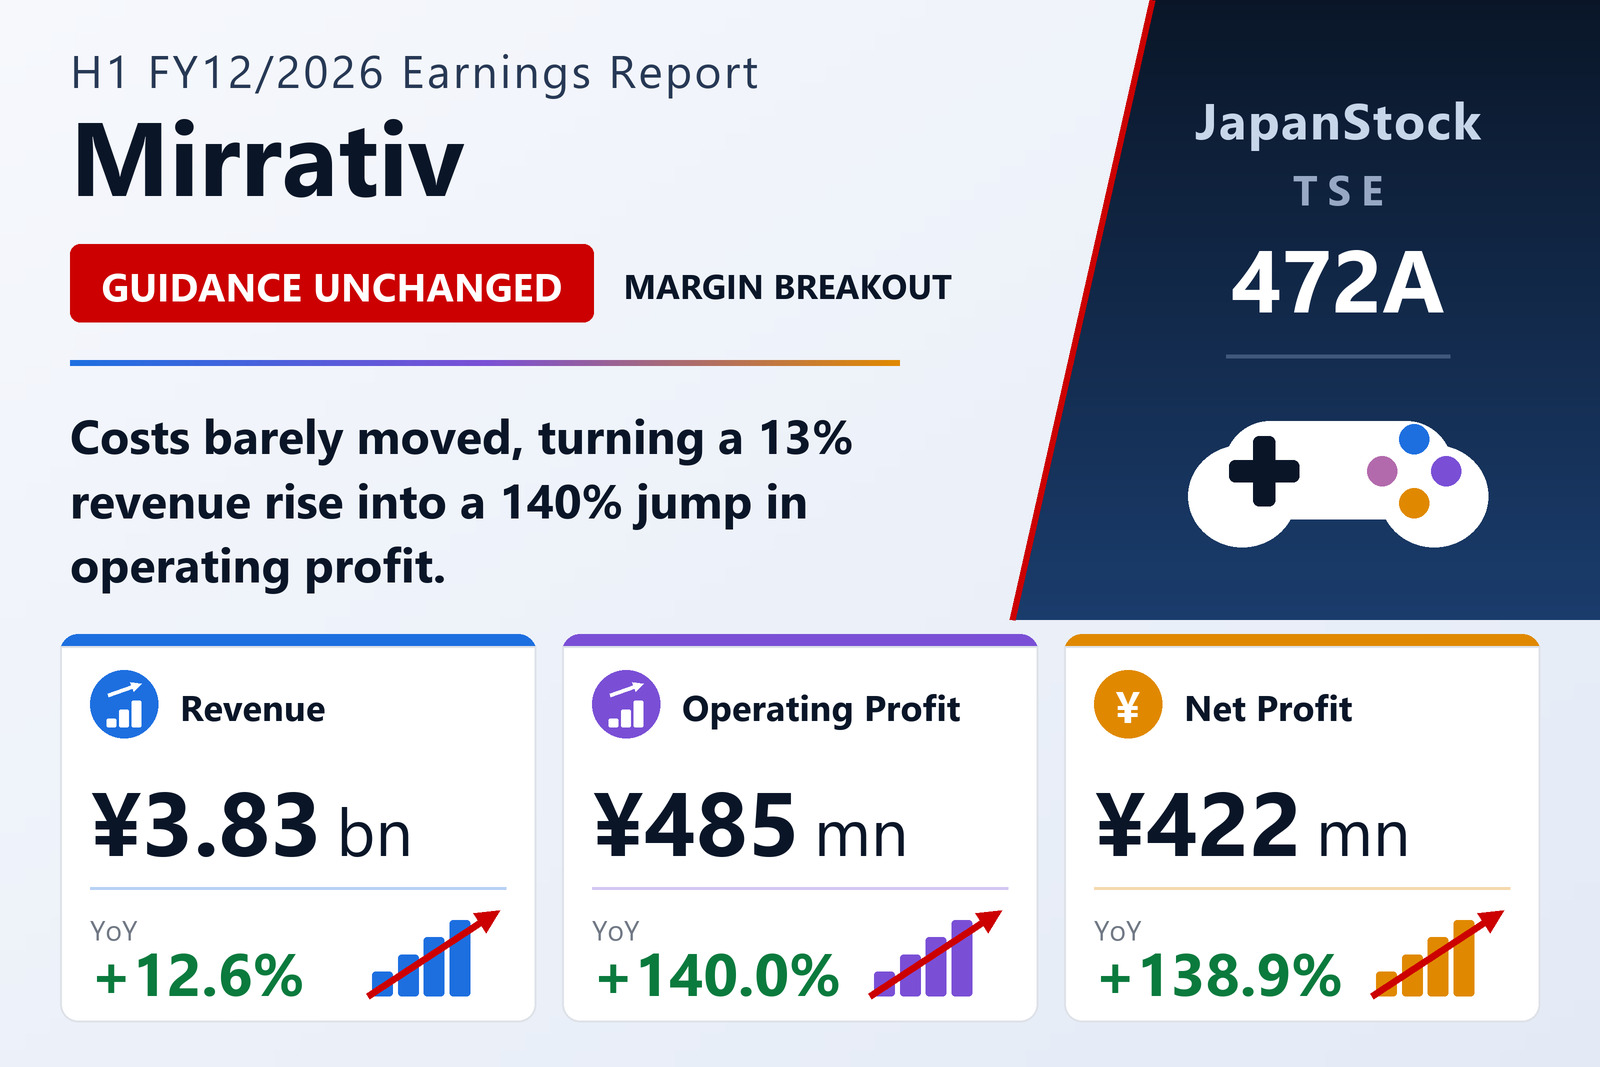
A 13% revenue rise converted into a 140% profit rise
Mirrativ, Inc. (TSE Growth: 472A), the Tokyo-based operator of the mobile game live-streaming platform Mirrativ, reported consolidated results for the first half of the year to December 2026 — January 1 to June 30, 2026 — under Japanese GAAP on August 14, 2026. Revenue came in at ¥3,825 million, up 12.6% year on year. Operating profit reached ¥485 million, up 140.0%; ordinary profit ¥453 million, up 154.2%; and net profit attributable to owners of parent ¥422 million, up 138.9%. Comprehensive income was identical to net profit at ¥422 million, there being no other comprehensive income items in the period. Basic earnings per share were ¥24.98 against ¥11.24 a year earlier, and diluted EPS was ¥24.16.
The shape of that result is the story. Revenue grew by roughly an eighth; operating profit grew by nearly two and a half times. The company's operating margin therefore widened from 6.0% to 12.7% in twelve months — a 6.7 percentage-point expansion that came almost entirely from operating leverage rather than from the top line. For a platform business whose costs are substantially fixed, that is the outcome the model is supposed to produce once revenue clears the cost base, and this is the first reporting period in which Mirrativ has shown it at scale.
One presentational note before the detail. No year-on-year percentages were disclosed for the comparative half of FY12/2025 in the prior release, because the group only began preparing consolidated financial statements from the end of the FY12/2024 fiscal year — so the prior-period columns in the company's own table carry dashes rather than growth rates. The comparison used throughout this article is against the reported first half of FY12/2025, which is a genuine consolidated period. Prior-year diluted EPS is the one figure that genuinely does not exist: dilutive potential shares were outstanding, but the company's stock was unlisted at the time and no average market price could be established, so no diluted figure could be computed.
Where the margin came from: costs that barely moved
The margin expansion is visible line by line. Cost of sales rose just 3.7%, to ¥2,407 million from ¥2,322 million, against revenue growth of 12.6%. Gross profit therefore jumped 32.1% to ¥1,418 million from ¥1,074 million, and the gross margin widened to 37.1% from 31.6%. Selling, general and administrative expenses grew a modest 7.0%, to ¥932 million from ¥871 million, which pulled the SG&A ratio down to 24.4% of revenue from 25.7%.
In other words, of the ¥429 million of incremental revenue the group booked in the half, roughly ¥344 million dropped through to gross profit and ¥283 million all the way to operating profit. Costs absorbed less than a third of the growth. Whether that ratio is repeatable is the central question for the rest of the year: platform businesses of this type typically carry a large fixed component in server, content and personnel costs and a variable component tied to creator payouts, and a half in which both grew far slower than revenue is a favourable but not automatically permanent configuration.
Emomo, IP collaborations, and the KPIs the tanshin does not give you
Mirrativ operates under the mission "connect the wish to understand one another," with a stated vision of building "a place where you connect through what you love and where your own story — your narrative — is born." The platform's distinguishing feature is Emomo, the proprietary avatar system through which users broadcast game commentary and live video without appearing on camera themselves. The group also develops what it calls "live gaming" — a category that fuses games and game commentary into a single experience — and supplies content and monetisation tools to streamers operating outside the Mirrativ app.
During the half the company released new Emomo items, including IP collaboration events, and ran its own ranking events, both aimed squarely at user engagement. Separately, consolidated subsidiary iBlade Inc. pursued VTuber-led promotional campaigns for game publishers and staged music events. Because the Mirrativ business dominates the group and no other segment is material, the company discloses no segment breakdown at all.
Investors looking for the operating metrics that usually accompany a platform disclosure will not find them here. The tanshin carries no user counts, no paying-user counts, no ARPU, no gifting or streaming-hours data and no split between gifting revenue and advertising revenue. The company did prepare supplementary explanatory materials and held a briefing for institutional investors and analysts, so those numbers may exist outside this document — but nothing in the earnings report itself allows the revenue line to be decomposed into users, conversion and spend per user. That is a real limitation on how far the reported growth can be diagnosed.
Below the operating line: an equity-method loss and a very light tax charge
Ordinary profit of ¥453 million sits ¥33 million below operating profit of ¥485 million, and the gap is almost entirely two items. The larger is a ¥29 million equity-method investment loss — matched precisely by a ¥29 million reduction in the carrying value of investment securities on the balance sheet — and the smaller is ¥5 million of interest expense. Non-operating income of ¥2 million, mostly interest received, offset a fraction of it. Ordinary profit still grew faster than operating profit (154.2% versus 140.0%) because the prior-year gap was proportionally wider.
The tax line deserves a closer look. Pre-tax interim profit of ¥453 million attracted an income tax charge of just ¥30 million — an effective rate of about 6.7%, far below Japan's statutory rate. The prior-year charge was lighter still at ¥1 million on ¥178 million of pre-tax profit. The balance sheet offers the explanation: the group carries ¥569 million of deferred tax assets, unchanged over the half, and until March of this year it carried accumulated losses of ¥2,320 million. Loss carryforwards of that size shelter current profits from tax, which flatters the net profit line for as long as they last — and, by definition, does not last indefinitely. Note also that under the special interim treatment permitted in Japan, tax expense here is computed by applying an estimated full-year effective rate to interim pre-tax profit rather than by a discrete calculation.
Balance sheet: 75% equity, net cash, and a deficit wiped clean
Total assets edged up 0.9% to ¥5,289 million from ¥5,240 million at the December 2025 year-end, but the composition changed materially. Cash and deposits rose ¥173 million to ¥3,565 million — 67% of the entire balance sheet — while accounts receivable fell ¥134 million and prepaid expenses rose ¥42 million. On the other side, total liabilities dropped ¥377 million to ¥1,318 million, with income taxes payable down ¥114 million, the current portion of long-term borrowings down ¥131 million and accounts payable down ¥44 million.
Net assets rose 12.0% to ¥3,971 million, and the equity ratio jumped to 75.1% from 67.7% — a 7.4 percentage-point improvement produced by both sides of the balance sheet moving the right way at once. Total interest-bearing debt of roughly ¥506 million sits against ¥3,565 million of cash, leaving the group with net cash of around ¥3,059 million.
The most consequential balance-sheet event of the half was not an operating one. On March 5, 2026, the board resolved to reduce the capital reserve by ¥2,231 million, transfer that amount to other capital surplus and then to retained earnings, thereby eliminating the accumulated deficit. Combined with the half's ¥423 million of profit, retained earnings swung from negative ¥2,320 million to positive ¥334 million. Net assets were unaffected — this is a reclassification within equity, not the creation of value — but under Japanese company law positive distributable reserves are a precondition for paying a dividend, and the group now has them. Cash flow was solid alongside it: operating cash flow of ¥320 million against ¥134 million a year earlier, investing outflows of only ¥12 million, and financing outflows of ¥136 million as ¥439 million of loan repayments and refinancing were partly offset by ¥300 million of new long-term borrowing.
No dividend is planned. The company paid nothing for FY12/2025 and forecasts ¥0.00 for FY12/2026. Per-share figures throughout reflect the 50-for-1 stock split executed on September 1, 2025, computed as if the split had occurred at the start of FY12/2025 — so any per-share comparison drawn from pre-split disclosures will be out by a factor of fifty unless similarly restated. The share count itself has barely moved: 16,955,500 shares issued at June 30 against 16,927,750 at the year-end, the difference reflecting stock option exercises.
Guidance unchanged — and the arithmetic of the second half
Mirrativ left its full-year FY12/2026 forecast exactly where it was set on February 13, 2026: revenue of ¥8,398 million, up 16.8%; operating profit of ¥1,109 million, up 217.6%; ordinary profit of ¥1,036 million, up 261.0%; net profit attributable to owners of parent of ¥962 million, up 30.2%; and EPS of ¥56.87.
Set the first half against those numbers and the second-half requirement is clear. Revenue of ¥3,825 million is 45.5% of the full-year target, leaving ¥4,573 million to be earned in the second half — an implied year-on-year growth rate of roughly 20%, against the 12.6% just delivered. Operating profit of ¥485 million is 43.8% of its target, leaving ¥623 million, or 56.2% of the year, for the second half. Ordinary profit stands at 43.7% and net profit at 44.0% of their respective targets. None of those ratios is alarming for a business with a seasonally weighted second half, and Mirrativ's own comparative figures imply the prior year was shaped the same way, with the great majority of FY12/2025 operating profit falling in the first half. But the guidance requires the second half to both grow revenue faster than the first half did and to convert that growth at a higher margin.
The one line where guidance looks conservative rather than demanding is net profit, forecast to grow only 30.2% while operating profit triples. Working back from the disclosed growth rates, FY12/2025 net profit of roughly ¥739 million sat well above that year's ordinary profit of roughly ¥287 million — a pattern consistent with a large one-off tax benefit, most plausibly the recognition of the deferred tax assets now sitting on the balance sheet. Measured against operations rather than against a flattered prior-year base, the profit trajectory implied by guidance is considerably steeper than the +30.2% headline suggests.
| Metric | H1 FY12/2026 | H1 FY12/2025 | Change |
|---|---|---|---|
| Revenue (¥ million) | 3,825 | 3,395 | +12.6% |
| Gross profit (¥ million) | 1,418 | 1,073 | +32.1% |
| Gross margin | 37.1% | 31.6% | +5.5 pt |
| Operating profit (¥ million) | 485 | 202 | +140.0% |
| Operating margin | 12.7% | 6.0% | +6.7 pt |
| Ordinary profit (¥ million) | 453 | 178 | +154.2% |
| Net profit attrib. to owners of parent (¥ million) | 422 | 177 | +138.9% |
| Basic EPS (¥) | 24.98 | 11.24 | +122.2% |
| Diluted EPS (¥) | 24.16 | — | — |
| Operating cash flow (¥ million) | 320 | 134 | +138.7% |
| Total assets (¥ million; vs Dec 31, 2025) | 5,289 | 5,240 | +0.9% |
| Net assets (¥ million; vs Dec 31, 2025) | 3,971 | 3,545 | +12.0% |
| Equity ratio (vs Dec 31, 2025) | 75.1% | 67.7% | +7.4 pt |
| Dividend per share (¥) | 0.00 | 0.00 | — |
JapanStockPulse provides informational content only and does not constitute investment advice. Figures are taken from the company's published earnings short report and may be subject to subsequent revision.