A margin story, not a volume story
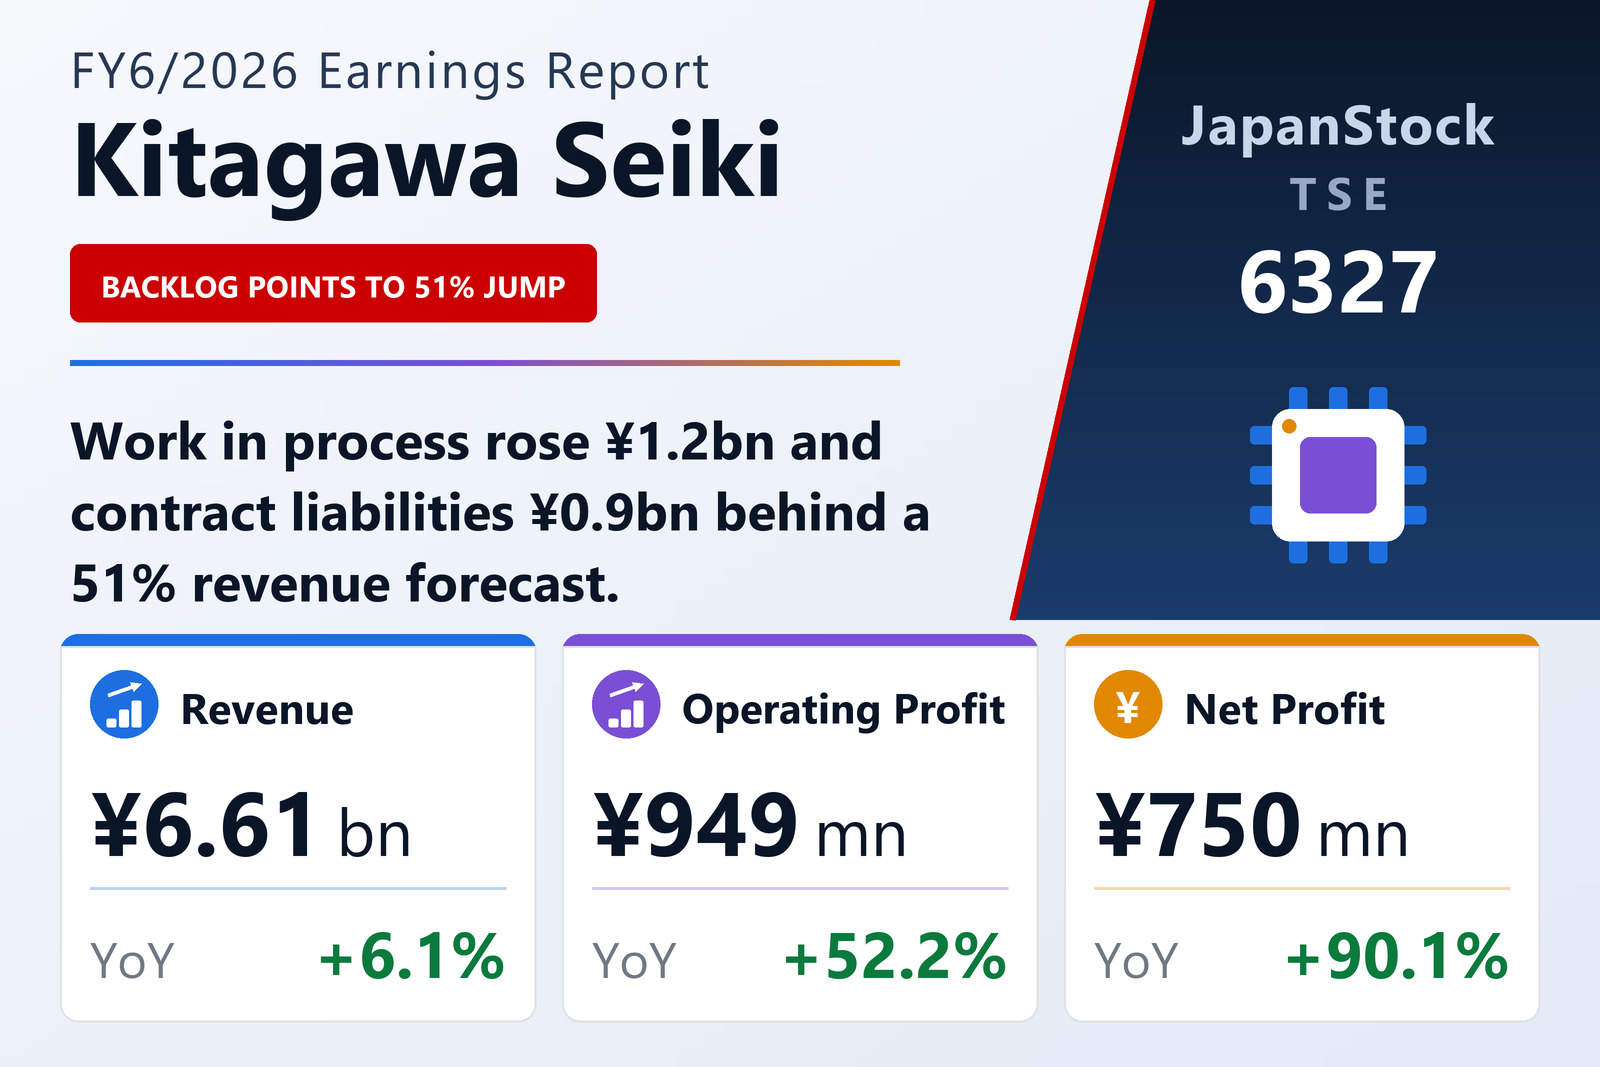
Kitagawa Seiki Co., Ltd. (TSE: 6327), the Hiroshima-based maker of press machines and vacuum lamination presses used in printed-circuit-board and electronics production, published consolidated results for the year ended June 30, 2026 under Japanese GAAP on August 18, 2026. Revenue rose 6.1% to ¥6,607 million from ¥6,227 million — a modest gain. Everything below it moved much faster: operating profit up 52.2% to ¥949 million, ordinary profit up 72.0% to ¥1,031 million, and net profit attributable to owners of parent up 90.1% to ¥750 million. Each of those three accelerations has a separate cause, and they are worth taking one at a time.
The step from revenue to operating profit is entirely a gross-margin move. Revenue added ¥380 million year on year, but cost of sales fell ¥4 million, to ¥4,860 million from ¥4,864 million. Gross profit therefore rose 28.2% to ¥1,747 million from ¥1,362 million, and the gross margin widened to 26.4% from 21.9% — 4.6 percentage points. Selling, general and administrative expenses rose 8.0% to ¥797 million from ¥738 million, an increase of ¥59 million against a ¥385 million gross-profit gain, leaving ¥326 million to fall through to the operating line. The operating margin reached 14.4%, from 10.0%.
The group reports a single segment. Industrial Machinery — the press equipment used to form copper-clad laminates and multilayer boards, plus the associated conveyance machinery — produced revenue of ¥6,505 million, up 7.1%, and segment profit of ¥947 million, up 53.2%. The remainder, hydraulic equipment disclosed under "Other" because it is immaterial, produced revenue of ¥102 million, down 32.6%, and profit of ¥6 million, up 38.0%. Essentially the whole company is the press business, and the press business is what improved.
Below the operating line: a currency gain and a lighter tax bill
Ordinary profit's 72.0% gain outruns operating profit's 52.2% because of items that have nothing to do with presses. Non-operating income leapt to ¥95 million from ¥12 million, almost all of it a ¥78 million foreign-exchange gain, where the prior year had instead carried a ¥23 million exchange loss among non-operating expenses. Non-operating expenses themselves fell to ¥13 million from ¥36 million. Netted out, the below-the-line contribution swung by ¥106 million — from a ¥24 million drag to an ¥82 million boost. Neither year carried extraordinary items, so pre-tax profit equals ordinary profit at ¥1,031 million.
Net profit's 90.1% gain then adds a third effect: tax. The total charge was ¥281 million on ¥1,031 million of pre-tax profit, an effective rate of 27.3%, against ¥205 million on ¥599 million, or 34.2%, a year earlier. Earnings per share came to ¥91.92 from ¥48.51, on a weighted average of 8,160,415 shares against 8,135,903; there are no potential dilutive shares, so no diluted figure is reported. Return on equity rose to 13.2% from 8.0% and the ordinary-profit-to-total-assets ratio to 10.7% from 7.0%.
Comprehensive income was ¥1,304 million, up 245.6% from ¥377 million — far ahead of net profit, because the group's investment portfolio was marked up. Other comprehensive income of ¥554 million comprised ¥520 million of valuation gains on available-for-sale securities, which lifted that reserve to ¥575 million, and ¥33 million of currency translation adjustment. That is a market-price effect on securities the company holds, not operating performance, and it is worth keeping separate from the ¥750 million the business itself earned.
The balance sheet is the order book
Total assets reached ¥10,732 million at June 30, 2026, up ¥2,141 million — a 24.9% expansion set against 6.1% revenue growth. The composition is what matters. Work in process rose ¥1,224 million to ¥1,970 million, 2.6 times the prior year's level; investment securities rose ¥761 million on the mark-up described above; cash and deposits rose ¥526 million; and advance payments, held inside other current assets, rose ¥281 million. Against that, notes and accounts receivable and contract assets fell ¥660 million.
Liabilities rose ¥915 million to ¥4,429 million, and the single largest move there is contract liabilities — customer cash collected against work not yet recognised as revenue — up ¥874 million to ¥1,354 million, 2.8 times the prior year. Electronically recorded obligations fell ¥133 million and long-term borrowings ¥121 million.
Those two lines are the reason to take next year's guidance seriously rather than dismiss it. Kitagawa Seiki designs and builds its main products to individual customer specifications, so lead times and order values vary widely, and the larger the project the longer it takes to convert into revenue — which is why the company warns that quarterly revenue swings sharply and that the annual figure is the meaningful unit. Work in process is precisely that unconverted work sitting in the factory; contract liabilities are cash already banked against it. Both roughly tripled while reported revenue moved 6.1%.
Net assets rose ¥1,225 million to ¥6,302 million. The reconciliation is clean: ¥750 million of net profit, plus ¥554 million of other comprehensive income and ¥18 million from the disposal of treasury shares, less ¥97 million of dividends paid. Because assets grew fractionally faster than equity, the equity ratio slipped to 58.7% from 59.1% even as net assets per share rose to ¥771.68 from ¥623.45.
Cash flow tells the same story from the other side. Operating cash flow was ¥759 million against ¥323 million: ¥1,031 million of pre-tax profit, an ¥869 million increase in contract liabilities and a ¥674 million reduction in trade receivables, against a ¥1,224 million increase in inventories, ¥290 million of income tax paid, a ¥279 million increase in advance payments and a ¥117 million increase in accrued consumption taxes. Investing used ¥66 million, mostly ¥48 million of property, plant and equipment. Financing used ¥219 million on ¥121 million of long-term debt repayment and ¥97 million of dividends. Cash and equivalents ended the year at ¥3,883 million, up ¥526 million.
Two disclosed ratios move sharply on that cash generation: interest-bearing debt to operating cash flow fell to 1.6 years from 4.1, and interest coverage rose to 62.1 times from 25.0. A third moves for an entirely different reason. The company's market-value equity ratio — market capitalisation divided by total assets — is disclosed at 601.2% against 58.7% a year earlier, which implies a market capitalisation of roughly ¥64 billion against about ¥5 billion. The market has already repriced this company by an order of magnitude; the earnings above, and the guidance below, are what it is being asked to justify.
Guidance: the 2030 revenue target, four years early — at a thinner margin
For FY6/2027 the company guides revenue of ¥10,000 million, up 51.3%; operating profit of ¥1,200 million, up 26.4%; ordinary profit of ¥1,180 million, up 14.3%; and net profit attributable to owners of parent of ¥810 million, up 8.0%, for EPS of ¥99.17. First-half guidance is revenue of ¥5,600 million, up 106.0%, operating profit of ¥680 million, up 34.2%, ordinary profit of ¥660 million, up 17.6%, and net profit of ¥450 million, up 16.4%, for EPS of ¥55.09 — meaning 56% of the year's revenue and 57% of its operating profit are guided into the first six months.
The asymmetry between a 51.3% revenue gain and an 8.0% net-profit gain is the whole point, and three separate compressions produce it. The operating margin falls to 12.0% from 14.4%, giving back most of this year's gross-margin improvement as the large projects convert. Ordinary profit is guided below operating profit — ¥1,180 million against ¥1,200 million — so the company is assuming a net non-operating expense of ¥20 million where this year delivered ¥82 million of income; in other words, no repeat of the currency gain. And the gap from ordinary to net implies a tax rate near 31%, back above this year's 27.3%. Net margin falls to 8.1% from 11.4%.
Set against the medium-term plan, that produces a split verdict. "KITAGAWA 2030", running from July 2024 to June 2030 and now in its second year, aims to make the company "the one-and-only company supporting the world's DX" through four priorities: executing a growth strategy toward ¥10 billion of revenue, combining capacity expansion with better profitability, deepening existing technology while improving product and service quality, and human-capital management to support its engineering base. Its FY6/2030 numeric targets are revenue of ¥10.0 billion, operating profit of ¥1.5 billion, an operating margin above 15% and ROE above 12%. FY6/2026 already clears the ROE target at 13.2% and comes within a hair of the margin target at 14.4%. FY6/2027 guidance clears the revenue target four years early — and misses both of the others, at ¥1,200 million of operating profit and a 12.0% margin.
Management's stated outlook is cautious in tone rather than in numbers: it flags concern over a global slowdown, unstable currency markets, and unstable supply of crude oil and petrochemical products from a prolonged Middle East situation. Describing the year just closed, it said Japan's economy recovered moderately, supported by improving employment and income conditions and by corporate capital investment, against unstable currency markets and continued inflation, while the global picture stayed opaque on higher raw material and energy prices, slowing Chinese growth and the effects of divergent monetary policies.
Dividend nearly doubles to ¥23, with ¥25 planned
The year-end dividend for FY6/2026 is ¥23.00 per share against ¥12.00 a year earlier, a 91.7% increase, paid entirely at the year-end with no interim distribution. The total payout is ¥187 million, a consolidated payout ratio of 25.0% and a dividend on equity of 3.0%, against ¥97 million, 24.7% and 2.0% for FY6/2025. For FY6/2027 the company plans a year-end dividend of ¥25.00, a payout ratio of 25.2% — the ratio held near-constant, so the dividend is being allowed to follow earnings rather than being set independently of them.
The stated capital policy is to maintain a balanced, optimal capital structure across financial soundness, capital efficiency and shareholder returns. On returns specifically, the company says it will keep stable dividends while retaining what is needed for technology innovation and competitiveness, capital investment for new markets, human development and R&D, and will buy back shares opportunistically where that would lift capital efficiency and the level of returns. It held 281,812 treasury shares at year-end, down from 305,212, out of 8,449,600 shares issued.
| Metric | FY6/2026 | FY6/2025 | Change |
|---|---|---|---|
| Revenue (¥ million) | 6,607 | 6,227 | +6.1% |
| Gross profit (¥ million) | 1,747 | 1,362 | +28.2% |
| Gross margin | 26.4% | 21.9% | +4.6 pt |
| SG&A expenses (¥ million) | 797 | 738 | +8.0% |
| Operating profit (¥ million) | 949 | 623 | +52.2% |
| Operating margin | 14.4% | 10.0% | +4.4 pt |
| Ordinary profit (¥ million) | 1,031 | 599 | +72.0% |
| Net profit attrib. to owners of parent (¥ million) | 750 | 394 | +90.1% |
| Comprehensive income (¥ million) | 1,304 | 377 | +245.6% |
| EPS (¥) | 91.92 | 48.51 | +89.5% |
| ROE | 13.2% | 8.0% | +5.2 pt |
| Total assets (¥ million) | 10,732 | 8,591 | +24.9% |
| Net assets (¥ million) | 6,302 | 5,077 | +24.1% |
| Equity ratio | 58.7% | 59.1% | −0.4 pt |
| Net assets per share (¥) | 771.68 | 623.45 | +23.8% |
| Operating cash flow (¥ million) | 759 | 323 | +134.8% |
| Cash and equivalents, year-end (¥ million) | 3,883 | 3,357 | +15.7% |
| Year-end dividend per share (¥) | 23.00 | 12.00 | +91.7% |
JapanStockPulse provides informational content only and does not constitute investment advice. Figures are taken from the company's published earnings short report and may be subject to subsequent revision.