Growth bought deliberately, and disclosed as such
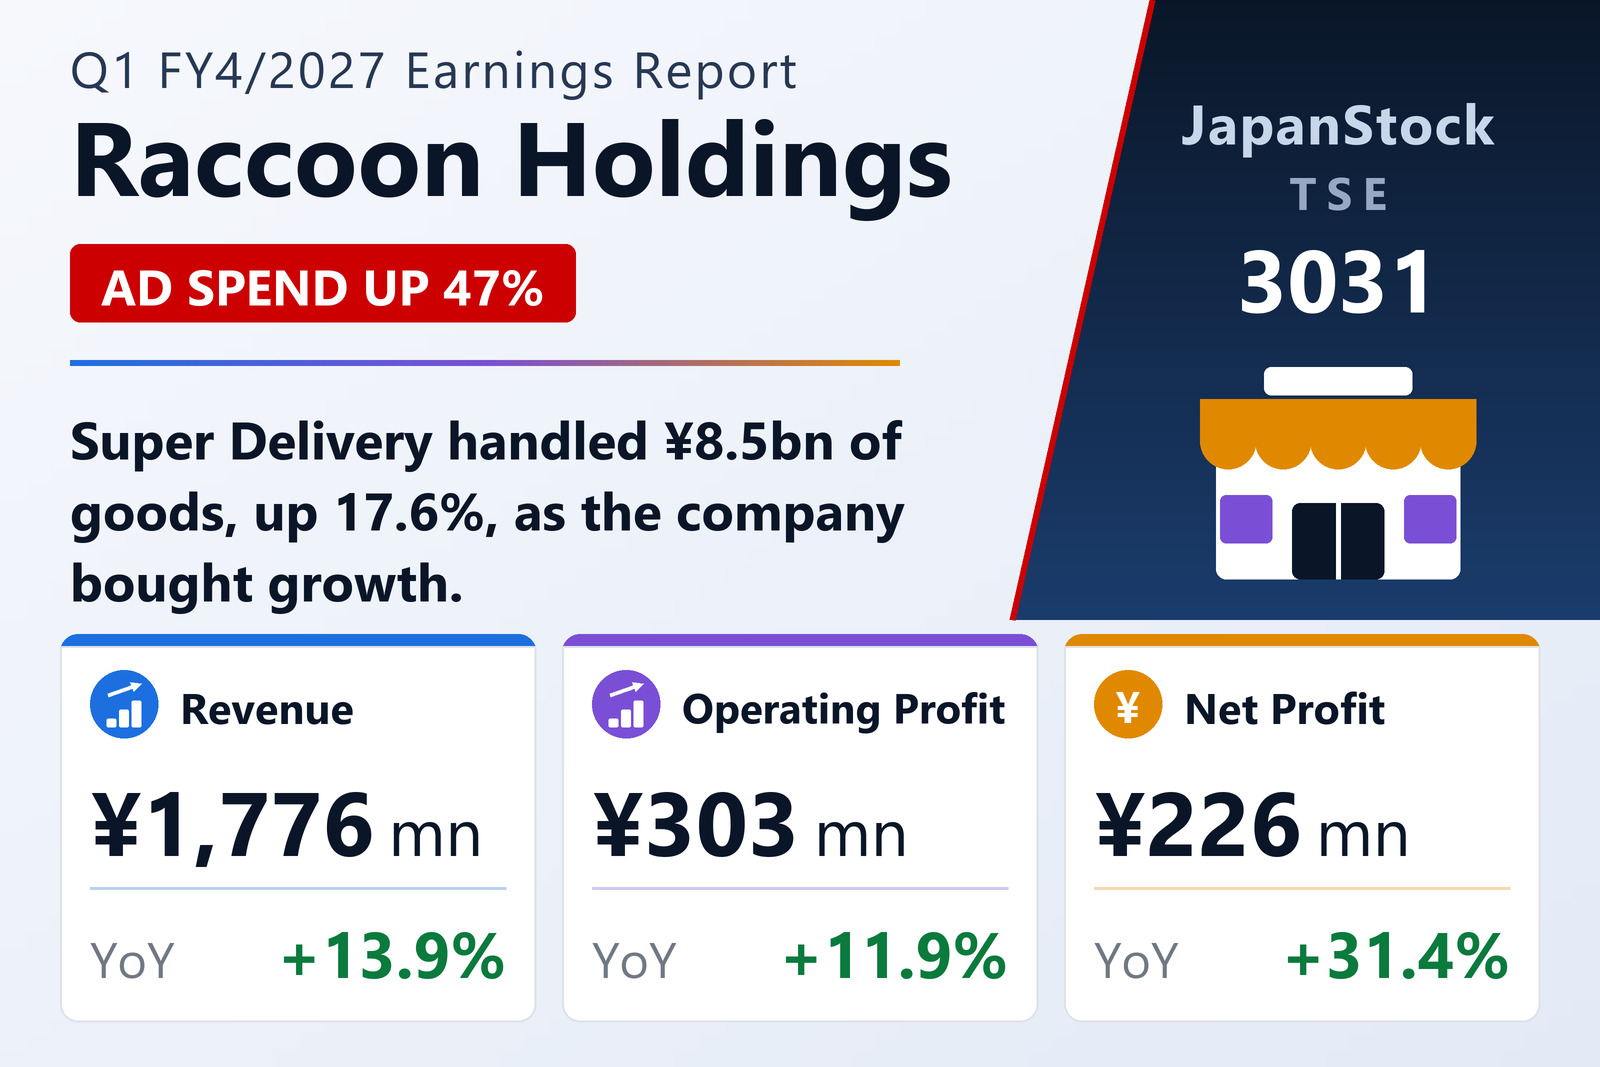
Raccoon Holdings, Inc. (TSE: 3031) published consolidated results for the three months to July 31, 2026 on August 31, 2026 under Japanese GAAP. Net sales rose 13.9% to ¥1,776 million, adjusted EBITDA 12.4% to ¥357 million, operating profit 11.9% to ¥303 million, ordinary profit 12.1% to ¥296 million and net profit 31.4% to ¥226 million, for earnings per share of ¥11.70 against ¥8.49.
The company describes the quarter as a deliberate step-up in spending to expand the customer base under the first year of its FY4/2027–FY4/2029 medium-term plan. Advertising expenses rose 47.0% year on year, personnel costs 3.2% and other costs 20.0%, for an 18.6% increase in selling, general and administrative expenses. Both the customer base and revenue per customer expanded, and the operating margin held at 17.1% against 17.4%.
It also puts the prior year's slower growth in context: FY4/2026 first-quarter sales grew only 2.3%, but that was depressed by the inclusion of Raccoon Rent — the rent-guarantee business transferred in October 2024 — in the FY4/2025 base. Excluding it, the like-for-like prior-year growth rate was 9.7%, so 13.9% represents a genuine acceleration.
Two segments whose profits fell for an accounting reason
EC sales rose 14.4% to ¥1,055 million and Financial sales 13.3% to ¥818 million, yet both segment profits fell — EC's 1.6% to ¥283 million and Financial's 15.4% to ¥153 million. The company is explicit that this is a booking change, not a deterioration: engineers and designers previously assigned to the holding company were transferred to the operating subsidiaries this quarter, so segment personnel costs rose sharply (EC +38.8%, Financial +51.9%) while holding-company costs fell by the same amount. Consolidated personnel costs and operating profit are unaffected — visible in the adjustment line, which shrank to −¥133 million from −¥198 million.
The underlying volume numbers grew faster than revenue. Super Delivery, the wholesale marketplace at the core of EC, handled ¥8,543 million of merchandise (+17.6%), with domestic volume up 19.7% and overseas up 11.7% — the latter notable because overseas buyer counts turned positive after a run of tariff-driven declines. In Financial, Paid handled ¥12,461 million outside the group (+13.5%), or ¥16,205 million including intra-group volume, driven by higher revenue per merchant as large active accounts expanded; URIHO's guarantee balance reached ¥80,320 million, up 5.1% from the year-end, as subscription customers upgraded plans.
Net profit flattered, and a dividend cut alongside unchanged guidance
Net profit grew 31.4% against an operating line up 11.9% because of a ¥52.8 million gain on the sale of investment securities booked as an extraordinary item. Operating cash flow swung to +¥427.6 million from −¥214.2 million, helped by a ¥269.4 million fall in receivables and offset by a ¥319.7 million fall in payables; cash ended at ¥5,165 million. Total assets fell 2.9% from the April year-end to ¥18,813 million, net assets 3.7% to ¥4,214 million after ¥327.4 million of dividends, and the equity ratio eased to 21.3% from 21.6%.
Guidance is unchanged and the company says the year is progressing broadly as planned — but the shape of it is unusual. Full-year FY4/2027 guidance is net sales of ¥7,500 million (+14.1%) with adjusted EBITDA of ¥1,050 million (−34.1%), operating profit of ¥600 million (−54.6%), ordinary profit of ¥550 million (−55.6%) and net profit of ¥300 million (−62.7%), for earnings per share of ¥15.47. First-half guidance is net sales of ¥3,450 million (+10.1%) and operating profit of ¥250 million (−56.5%). The quarter has already delivered 50.5% of the full-year operating-profit target on 23.7% of the sales target, so the guided decline sits almost entirely in the remaining nine months of planned investment. The annual dividend is cut to ¥22.00 from ¥27.00, split ¥11.00 interim and ¥11.00 final.
| Metric | Q1 FY4/2027 | Q1 FY4/2026 | Change |
|---|---|---|---|
| Net sales (¥ million) | 1,776 | 1,559 | +13.9% |
| Adjusted EBITDA (¥ million) | 357 | 317 | +12.4% |
| Operating profit (¥ million) | 303 | 271 | +11.9% |
| Operating margin | 17.1% | 17.4% | −0.3 pt |
| Ordinary profit (¥ million) | 296 | 264 | +12.1% |
| Net profit (¥ million) | 226 | 172 | +31.4% |
| EPS (¥) | 11.70 | 8.49 | +37.8% |
| EC — revenue (¥ million) | 1,055 | 922 | +14.4% |
| EC — segment profit (¥ million) | 283 | 287 | −1.6% |
| Financial — revenue (¥ million) | 818 | 722 | +13.3% |
| Financial — segment profit (¥ million) | 153 | 181 | −15.4% |
| Total assets (¥ million) | 18,813 | 19,380 | −2.9% |
| Net assets (¥ million) | 4,214 | 4,376 | −3.7% |
| Equity ratio | 21.3% | 21.6% | −0.3 pt |
| FY4/2027 guidance — revenue (¥ million) | 7,500 | — | +14.1% |
| FY4/2027 guidance — adjusted EBITDA (¥ million) | 1,050 | — | −34.1% |
| FY4/2027 guidance — operating profit (¥ million) | 600 | — | −54.6% |
| FY4/2027 guidance — ordinary profit (¥ million) | 550 | — | −55.6% |
| FY4/2027 guidance — net profit (¥ million) | 300 | — | −62.7% |
| FY4/2027 guidance — EPS (¥) | 15.47 | — | n.m. |
| Annual dividend per share (¥) | 22.00 | 27.00 | −18.5% |
JapanStockPulse provides informational content only and does not constitute investment advice. Figures are taken from the company's published earnings short report and may be subject to subsequent revision.