A supplier of the chemicals that get deposited on a wafer
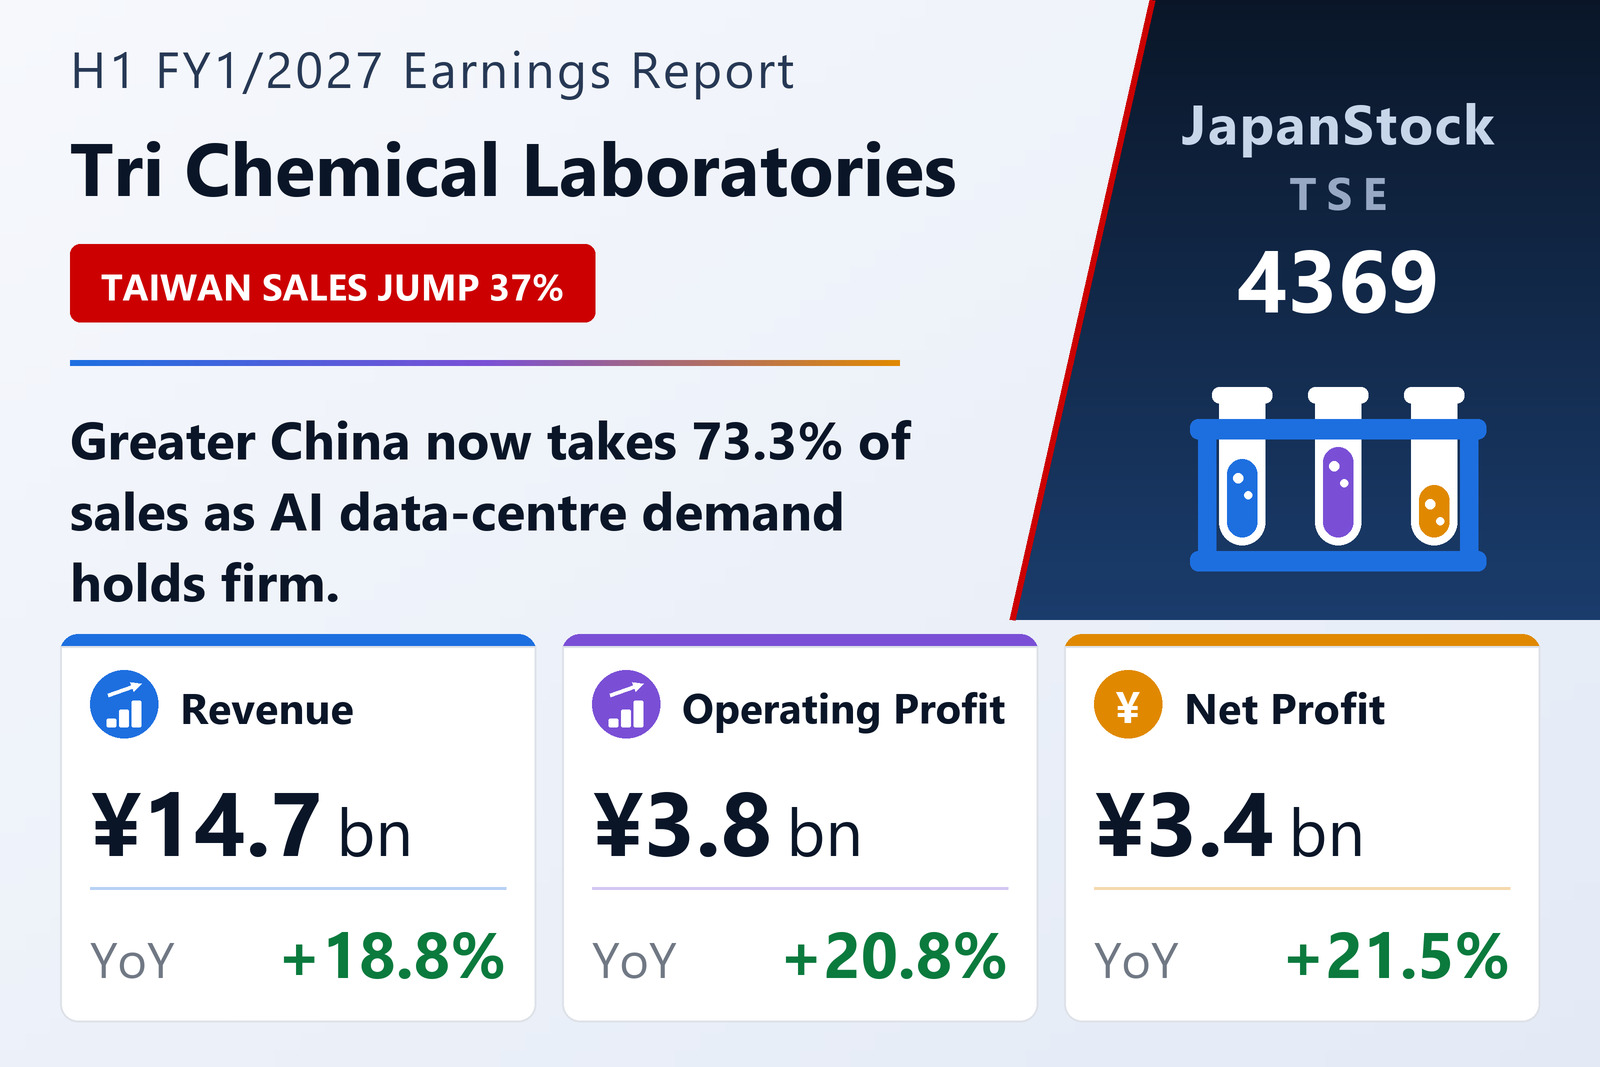
Tri Chemical Laboratories Inc. (TSE: 4369) published consolidated results for the six months to July 31, 2026 on August 31, 2026 under Japanese GAAP. Net sales rose 18.8% to ¥14,705 million, operating profit 20.8% to ¥3,838 million, ordinary profit 19.1% to ¥4,526 million and net profit 21.5% to ¥3,373 million, for earnings per share of ¥103.81 against ¥85.45.
The company makes high-purity chemical compounds for semiconductor manufacturing and runs the business as a single segment. It describes the end market plainly: consumer demand such as smartphones still lacks strength, but data-centre investment tied to the spread of generative AI and capital appetite centred on leading-edge logic and memory have held firm, and demand for high-purity compounds has risen with them.
The operating margin widened to 26.1% from 25.7% — profit grew slightly faster than sales despite raw-material and energy costs, which the company met with company-wide cost reduction, selling-price revisions and closer coordination between group companies and divisions. Ordinary profit again exceeded operating profit, by ¥688 million against ¥623 million a year earlier, chiefly through equity-method income from the Korean affiliate SK Tri Chem Co., Ltd.
Where the growth came from
The geographic split is uneven in a way worth noting. Taiwan rose 36.9% to ¥4,950 million and China 25.5% to ¥5,841 million — together ¥2,520 million of the ¥2,330 million total increase, meaning the two more than accounted for all of it. Japan slipped 0.5% to ¥2,206 million, South Korea 2.1% to ¥1,276 million and other regions 25.8% to ¥433 million. Greater China now takes 73.3% of sales against 66.8% a year earlier.
By application, the two largest lines both grew strongly: High-k materials rose 17.3% to ¥7,132 million and metal materials 36.9% to ¥3,198 million. Etching materials were nearly flat at ¥1,870 million (+2.6%), other silicon-semiconductor uses rose 31.4% to ¥1,997 million, and non-silicon applications fell 17.1% to ¥509 million. On capacity, the company continues to build out the production system at its Minami-Alps site, the base for new etching materials, and to strengthen production and quality control for new AI-related materials.
Balance sheet, guidance and dividend
Total assets rose 3.9% from the January year-end to ¥49,121 million. Current assets grew ¥1,191 million on higher cash, and fixed assets ¥655 million as equity-method income lifted investment securities. Current liabilities fell ¥2,015 million while fixed liabilities rose ¥1,761 million on higher long-term borrowings — a maturity shift rather than a change in leverage. Net assets rose 5.8% to ¥38,249 million and the equity ratio improved to 77.9% from 76.5%.
Full-year FY1/2027 guidance was revised, announced separately the same day alongside the variance between first-half guidance and actuals. It now stands at net sales of ¥29,500 million (+23.5%), operating profit of ¥7,450 million (+26.2%), ordinary profit of ¥8,720 million (+23.0%) and net profit of ¥6,570 million (+19.1%), for earnings per share of ¥202.17. The half therefore represents 51.5% of the full-year operating-profit target on 49.8% of the sales target. The annual dividend is held at ¥35.00, paid entirely at year-end with no interim.
| Metric | H1 FY1/2027 | H1 FY1/2026 | Change |
|---|---|---|---|
| Net sales (¥ million) | 14,705 | 12,375 | +18.8% |
| Operating profit (¥ million) | 3,838 | 3,177 | +20.8% |
| Operating margin | 26.1% | 25.7% | +0.4 pt |
| Ordinary profit (¥ million) | 4,526 | 3,800 | +19.1% |
| Net profit (¥ million) | 3,373 | 2,776 | +21.5% |
| EPS (¥) | 103.81 | 85.45 | +21.5% |
| Japan — revenue (¥ million) | 2,206 | 2,217 | −0.5% |
| China — revenue (¥ million) | 5,841 | 4,654 | +25.5% |
| Taiwan — revenue (¥ million) | 4,950 | 3,616 | +36.9% |
| South Korea — revenue (¥ million) | 1,276 | 1,304 | −2.1% |
| Other regions — revenue (¥ million) | 433 | 584 | −25.8% |
| Total assets (¥ million) | 49,121 | 47,274 | +3.9% |
| Net assets (¥ million) | 38,249 | 36,149 | +5.8% |
| Equity ratio | 77.9% | 76.5% | +1.4 pt |
| FY1/2027 guidance — revenue (¥ million) | 29,500 | — | +23.5% |
| FY1/2027 guidance — operating profit (¥ million) | 7,450 | — | +26.2% |
| FY1/2027 guidance — ordinary profit (¥ million) | 8,720 | — | +23.0% |
| FY1/2027 guidance — net profit (¥ million) | 6,570 | — | +19.1% |
| FY1/2027 guidance — EPS (¥) | 202.17 | — | n.m. |
| Annual dividend per share (¥) | 35.00 | 35.00 | unchanged |
JapanStockPulse provides informational content only and does not constitute investment advice. Figures are taken from the company's published earnings short report and may be subject to subsequent revision.