A profit number driven by tax, not by trading
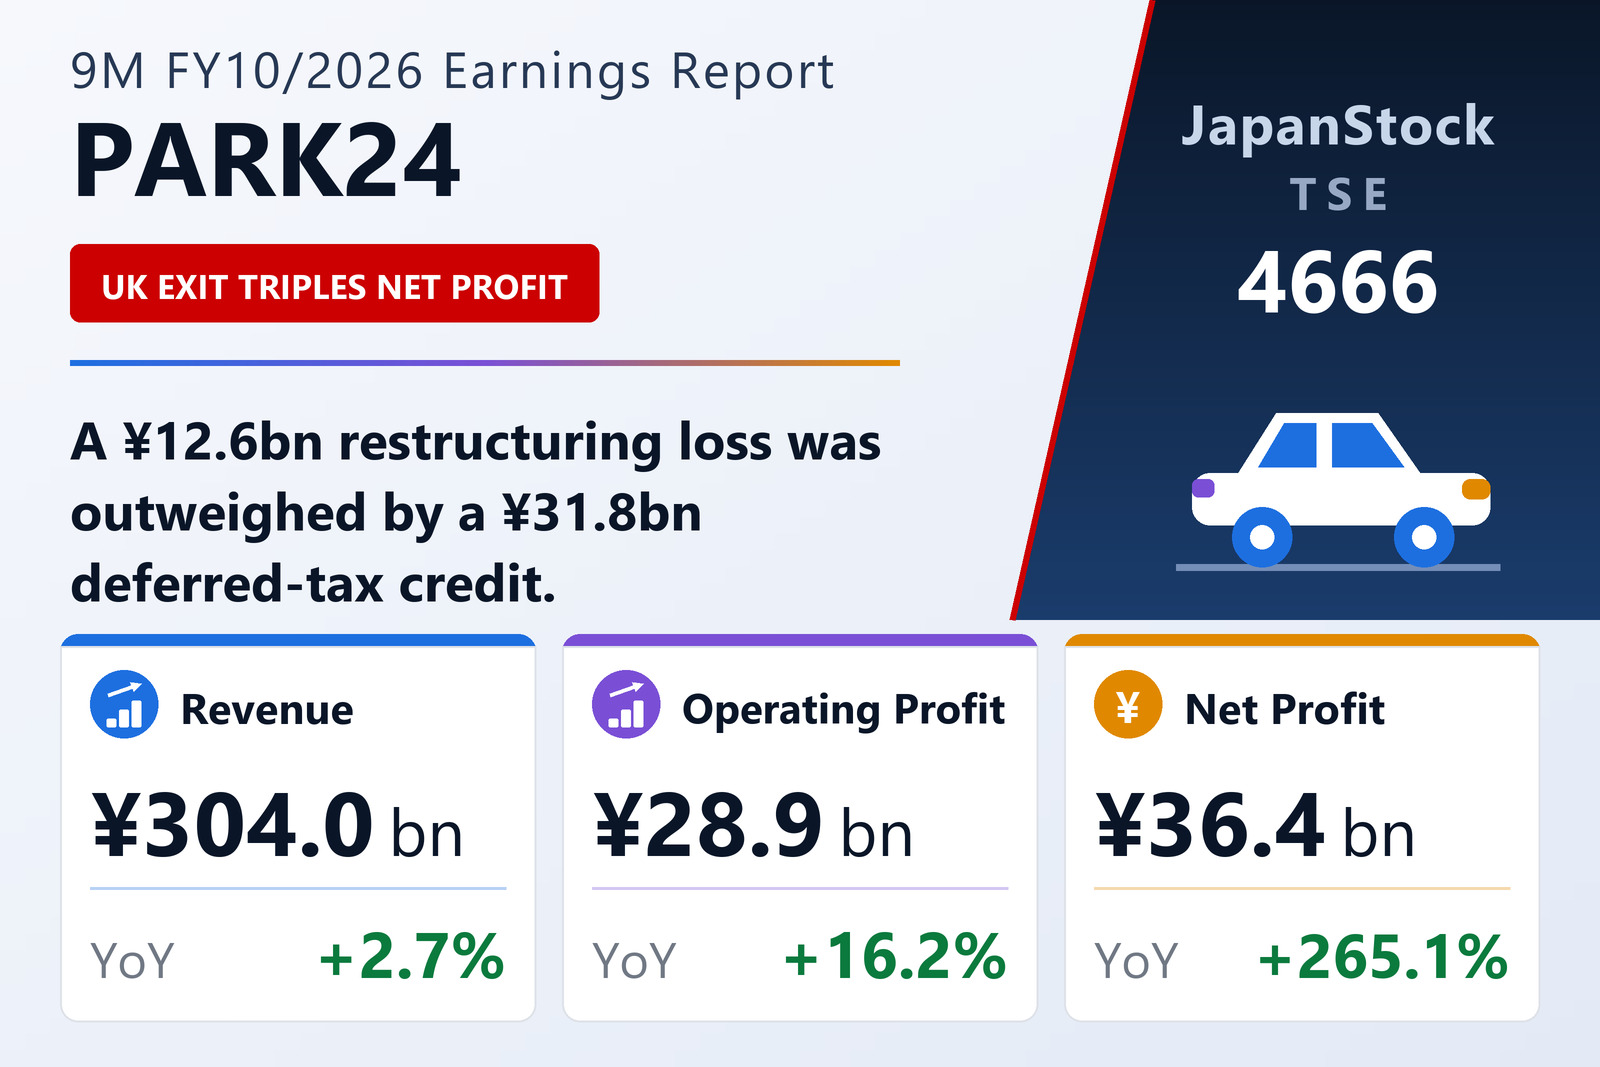
PARK24 Co., Ltd. (TSE: 4666) published consolidated results for the nine months to July 31, 2026 on August 31, 2026 under Japanese GAAP. Net sales rose 2.7% to ¥304,049 million, operating profit 16.2% to ¥28,946 million, ordinary profit 20.0% to ¥26,726 million and net profit 265.1% to ¥36,354 million, for earnings per share of ¥212.97 against ¥58.35.
The bottom-line figure needs reading carefully. In the second quarter the group restructured its UK business and sold its Singapore business, booking an extraordinary loss of ¥12.6 billion. Against that it recorded a ¥31.8 billion income-tax adjustment credit, largely arising from the UK restructuring, which is why net profit exceeded ordinary profit by ¥9,628 million. Four subsidiaries left the consolidation: PARK24 INTERNATIONAL LIMITED, MEIF II CP Holdings 2 Limited, NATIONAL CAR PARKS LIMITED and TIMES24 SINGAPORE PTE. LTD.
That deconsolidation is also why group sales grew only 2.7% while both domestic segments grew at high single digits or better: overseas parking revenue fell 26.8% to ¥45,210 million, taking ¥16,594 million out of the top line. Excluding that segment, the two remaining businesses added ¥24,629 million between them.
Domestic parking and mobility both grew; overseas returned to profit
Parking Japan grew revenue 9.1% to ¥160,705 million but segment profit only 3.4% to ¥28,496 million. The company developed 1,291 new lots in the period, all cashless-payment-only as a matter of policy from this financial year, and is converting existing lots to its own Times Tower payment machines and licence-plate cameras. Times Parking sites reached 20,400 (+3.7%) and 749,771 spaces (+7.5%); including monthly and managed lots the group operated 27,668 sites and 917,152 spaces.
Mobility grew revenue 12.3% to ¥103,338 million and segment profit 14.3% to ¥10,375 million. Times Car dedicated vehicles rose 5,853 to 69,733, stations rose 4,426 to 30,499 and members rose 441,000 to 4,057,000. Membership is growing faster than the fleet — up 18.0% year on year against 12.9% for vehicles — so members per vehicle are improving; the company notes, however, that revenue per vehicle came in below plan, and that mobility service utilisation as a whole fell short of expectations while both parking segments beat them.
Parking Overseas returned to profit at ¥400 million against a ¥1,767 million loss, despite the sharply lower revenue base — goodwill amortisation within it fell to ¥760 million from ¥1,072 million. Australian occupancy came in below plan while other regions were broadly firm. The UK restructuring moved that business away from large, long-lease car parks toward the group's small, short-lease "Times Parking" format, the same "small, dispersed, dominant" strategy it uses at home.
Balance sheet, dividend and guidance
Total assets were near flat at ¥355,014 million, but net assets rose 20.0% to ¥117,826 million and the equity ratio improved to 33.2% from 27.7% — the clearest balance-sheet consequence of the year's disposals and the tax credit. The full-year dividend is set at ¥65.00 against ¥30.00, all payable at year-end, and is unrevised from the previous announcement.
Guidance for FY10/2026 is unchanged: net sales of ¥411,000 million (+1.2%), operating profit of ¥42,500 million (+13.1%), ordinary profit of ¥39,500 million (+15.6%) and net profit of ¥44,000 million (+176.4%), for earnings per share of ¥257.76. Nine months delivered 68.1% of the full-year operating-profit target on 74.0% of the sales target, so the final quarter is expected to carry a disproportionate share of the profit. Note that overseas subsidiaries are consolidated on a lagged calendar — their nine months run to June 30 rather than July 31.
| Metric | 9M FY10/2026 | 9M FY10/2025 | Change |
|---|---|---|---|
| Net sales (¥ million) | 304,049 | 295,915 | +2.7% |
| Operating profit (¥ million) | 28,946 | 24,914 | +16.2% |
| Operating margin | 9.5% | 8.4% | +1.1 pt |
| Ordinary profit (¥ million) | 26,726 | 22,270 | +20.0% |
| Net profit (¥ million) | 36,354 | 9,956 | +265.1% |
| EPS (¥) | 212.97 | 58.35 | +265.0% |
| Parking — Japan — revenue (¥ million) | 160,705 | 147,362 | +9.1% |
| Parking — Japan — segment profit (¥ million) | 28,496 | 27,565 | +3.4% |
| Mobility — revenue (¥ million) | 103,338 | 92,052 | +12.3% |
| Mobility — segment profit (¥ million) | 10,375 | 9,074 | +14.3% |
| Parking — Overseas — revenue (¥ million) | 45,210 | 61,804 | −26.8% |
| Parking — Overseas — segment profit (¥ million) | 400 | −1,767 | loss to profit |
| Total assets (¥ million) | 355,014 | 354,376 | +0.2% |
| Net assets (¥ million) | 117,826 | 98,193 | +20.0% |
| Equity ratio | 33.2% | 27.7% | +5.5 pt |
| FY10/2026 guidance — revenue (¥ million) | 411,000 | — | +1.2% |
| FY10/2026 guidance — operating profit (¥ million) | 42,500 | — | +13.1% |
| FY10/2026 guidance — ordinary profit (¥ million) | 39,500 | — | +15.6% |
| FY10/2026 guidance — net profit (¥ million) | 44,000 | — | +176.4% |
| FY10/2026 guidance — EPS (¥) | 257.76 | — | n.m. |
| Annual dividend per share (¥) | 65.00 | 30.00 | +116.7% |
JapanStockPulse provides informational content only and does not constitute investment advice. Figures are taken from the company's published earnings short report and may be subject to subsequent revision.