Revenue grew; the gross margin did the damage
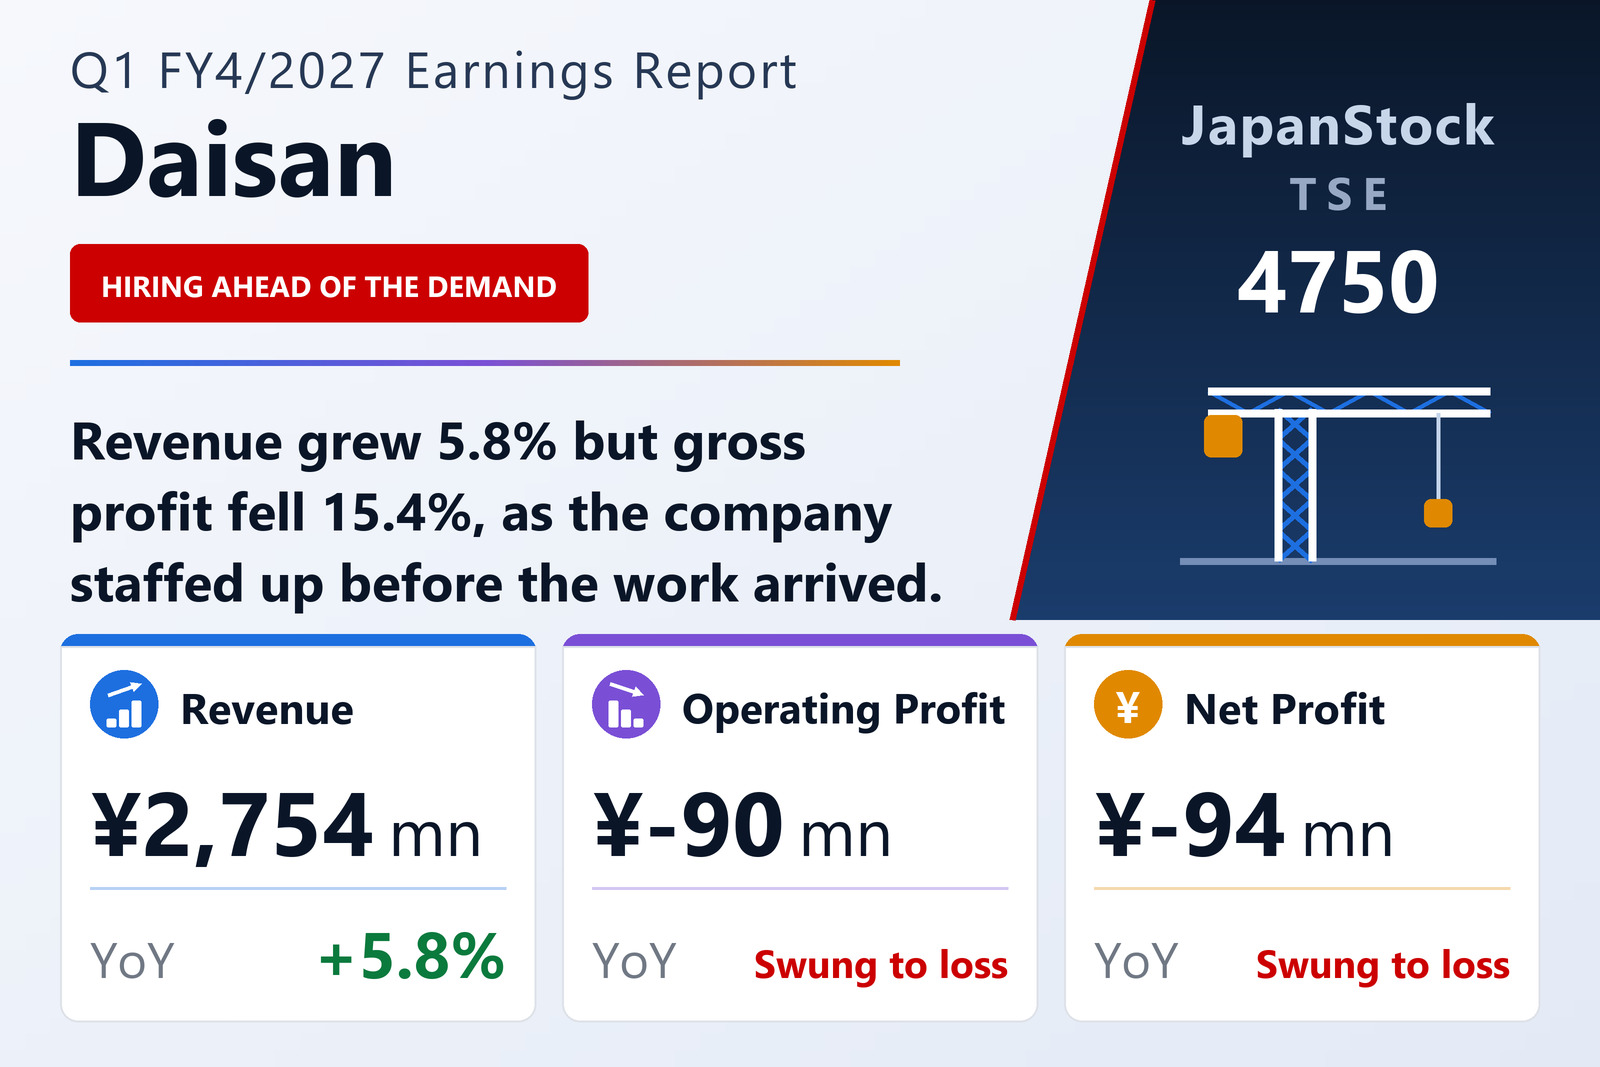
DAISAN Co., Ltd. (TSE: 4750) published consolidated results for the three months to July 20, 2026 on September 1, 2026 under Japanese GAAP. Net sales rose 5.8% to ¥2,754 million, but the company reported an operating loss of ¥90 million against a ¥42 million profit, an ordinary loss of ¥94 million against a ¥69 million profit and a net loss of ¥94 million against a ¥104 million profit, for a loss per share of ¥14.80 against earnings of ¥16.30.
The bridge is entirely in the gross margin. Gross profit fell 15.4% to ¥644 million on 5.8% higher sales, so the gross margin dropped to 23.4% from 29.2%. The company's own explanation for the core business is direct: it has been building installation capacity ahead of the orders it expects, and the personnel costs came first.
That shows up segment by segment. Construction Services grew revenue 6.4% to ¥1,905 million on stronger orders for mid-rise large buildings and a larger share of existing customers, but its gross profit fell 4.5% to ¥478 million on those staffing costs. Product Sales fell 21.2% to ¥224 million with gross profit down 30.0%, and Overseas grew revenue 18.7% to ¥610 million while its gross profit fell 42.9% to ¥94 million. Note that the company defines segment profit as gross profit, not operating profit.
Two acquisitions, and a housing market rebounding off a low base
In the quarter the group bought Penguin Engineering & Construction Pte. Ltd. of Singapore, to widen the overseas customer base and create synergies in engineering, and Daiwa Sangyo Co., Ltd., a scaffolding contractor in Fukushima Prefecture, to secure a new trading area and add installation capacity. The Daiwa Sangyo purchase generated ¥257.9 million of goodwill; a third company, Golden Light House Engineering Pte. Ltd., was also consolidated, generating ¥4.5 million of goodwill that was written off immediately as immaterial.
The market backdrop was unusually favourable on volume. Japanese housing starts rose sharply against a weak prior-year base that followed the Building Standards Act revision: owner-occupied homes +21.6%, rental +24.3% and built-for-sale +17.1%. Against that, high building-material prices and rising mortgage rates continued to weigh on consumer appetite.
Balance sheet and an unchanged full-year target
Total assets rose 2.1% from the April year-end to ¥10,398 million, while net assets fell 2.4% to ¥5,587 million after the loss, taking the equity ratio to 53.7% from 56.2% and net assets per share to ¥871.25 from ¥892.93. Comprehensive income was a loss of ¥68 million against a ¥72 million profit.
Guidance is unchanged: net sales of ¥12,000 million (+7.7%), operating profit of ¥280 million (+4.1%), ordinary profit of ¥220 million (−24.4%) and net profit of ¥130 million (−50.4%), for earnings per share of ¥20.27. With the first quarter ¥90 million below the line, the remaining nine months have to produce ¥370 million of operating profit to reach that target — which the company frames as the third year of its fourth medium-term plan, built on deepening core business areas, creating new earnings streams and strengthening the management base. The annual dividend is held at ¥22.00, split ¥11.00 interim and ¥11.00 final.
| Metric | Q1 FY4/2027 | Q1 FY4/2026 | Change |
|---|---|---|---|
| Net sales (¥ million) | 2,754 | 2,603 | +5.8% |
| Gross profit (¥ million) | 644 | 761 | −15.4% |
| Operating profit (¥ million) | −90 | 42 | profit to loss |
| Ordinary profit (¥ million) | −94 | 69 | profit to loss |
| Net profit (¥ million) | −94 | 104 | profit to loss |
| EPS (¥) | −14.80 | 16.30 | profit to loss |
| Construction Services — revenue (¥ million) | 1,905 | 1,791 | +6.4% |
| Construction Services — segment gross profit (¥ million) | 478 | 501 | −4.5% |
| Product Sales — revenue (¥ million) | 224 | 284 | −21.2% |
| Product Sales — segment gross profit (¥ million) | 58 | 83 | −30.0% |
| Overseas — revenue (¥ million) | 610 | 514 | +18.7% |
| Overseas — segment gross profit (¥ million) | 94 | 164 | −42.9% |
| Total assets (¥ million) | 10,398 | 10,180 | +2.1% |
| Net assets (¥ million) | 5,587 | 5,726 | −2.4% |
| Equity ratio | 53.7% | 56.2% | −2.5 pt |
| FY4/2027 guidance — revenue (¥ million) | 12,000 | — | +7.7% |
| FY4/2027 guidance — operating profit (¥ million) | 280 | — | +4.1% |
| FY4/2027 guidance — ordinary profit (¥ million) | 220 | — | −24.4% |
| FY4/2027 guidance — net profit (¥ million) | 130 | — | −50.4% |
| FY4/2027 guidance — EPS (¥) | 20.27 | — | n.m. |
| Annual dividend per share (¥) | 22.00 | 22.00 | unchanged |
JapanStockPulse provides informational content only and does not constitute investment advice. Figures are taken from the company's published earnings short report and may be subject to subsequent revision.