One segment produced the whole increase
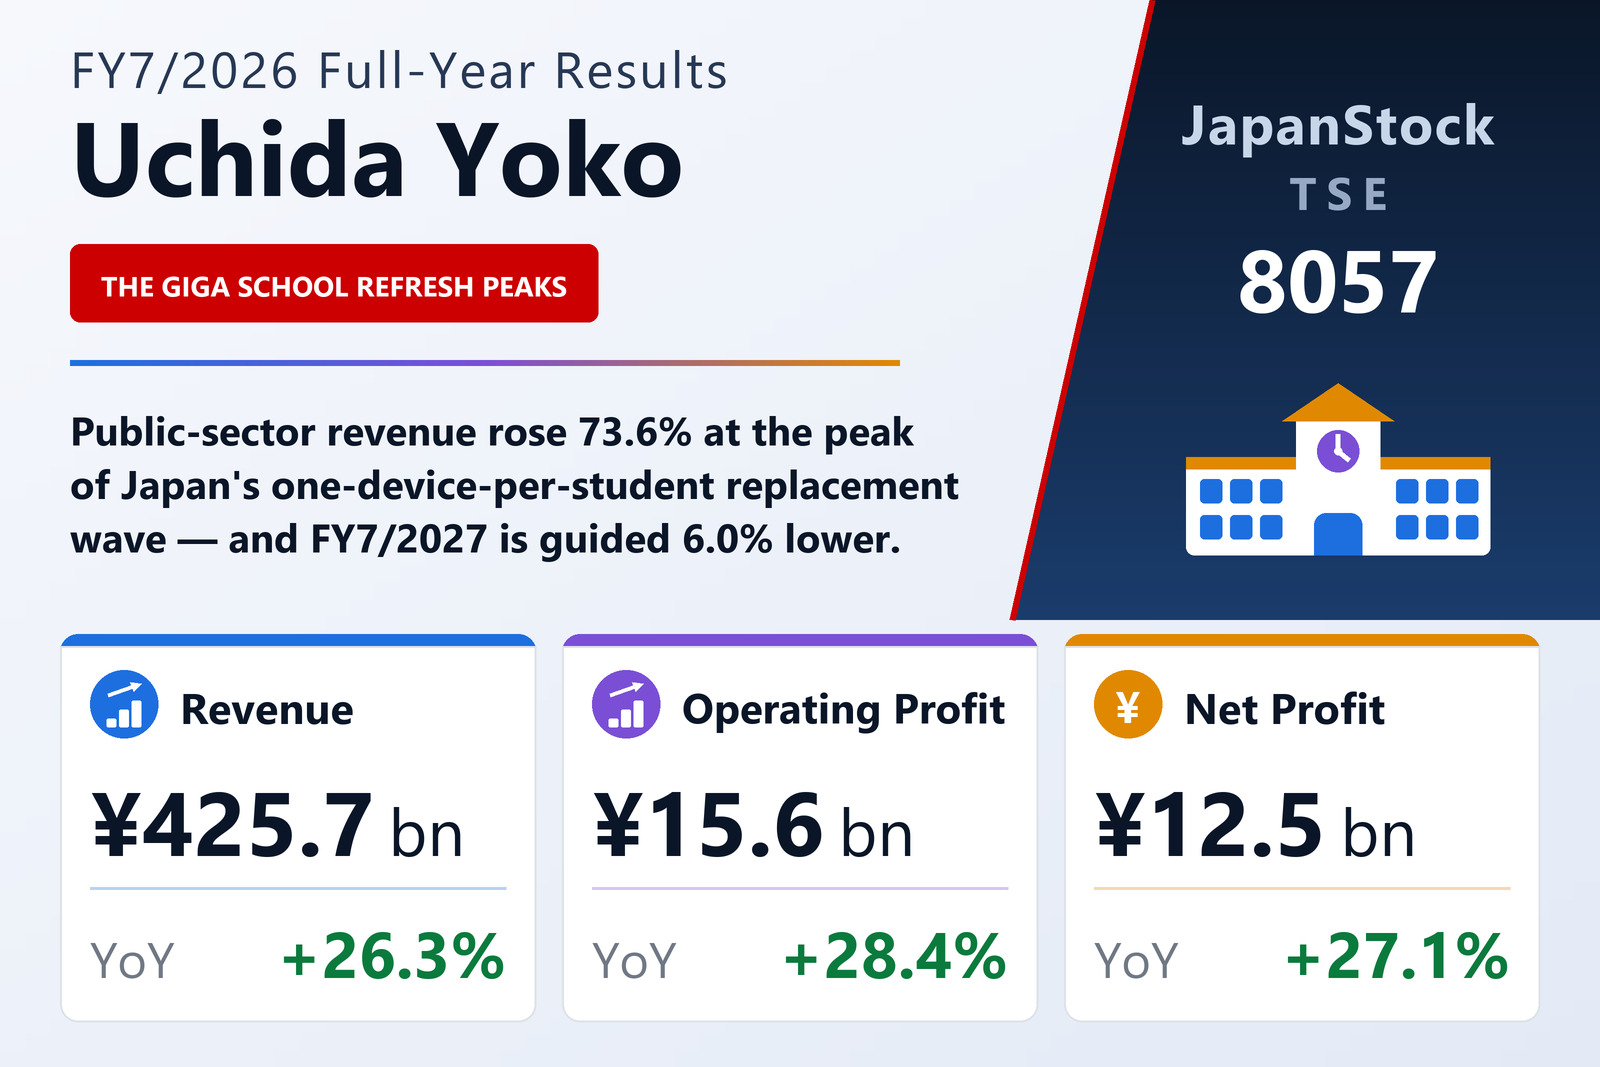
Uchida Yoko Co., Ltd. (TSE: 8057), the office and education systems integrator, published consolidated results for the year to July 20, 2026 on September 2, 2026 under Japanese GAAP. Net sales rose 26.3% to ¥425,729 million, operating profit 28.4% to ¥15,631 million, ordinary profit 27.8% to ¥16,770 million and net profit 27.1% to ¥12,486 million, for earnings per share of ¥253.23 against ¥199.45. Return on equity reached 16.0% against 14.5%.
The shape of the year is unusual: gross profit rose only 13.1% to ¥59,240 million against a 26.3% revenue gain, so the operating margin barely moved, to 3.7% from 3.6%. That is what a low-margin hardware wave looks like passing through a systems integrator. Operating profit grew because selling and administrative expenses rose just 8.4%, far behind revenue.
Public Sector supplied essentially the whole increase: external revenue up 73.6% to ¥161,038 million and segment profit up 71.2% to ¥8,974 million. The company attributes it to the peak of replacement demand under Japan's GIGA School programme, which put one device in the hands of every schoolchild and is now refreshing them nationwide at once. It says its kitting-centre capacity, expanded the previous year, let it deliver mass rollouts smoothly, and that it won large network contracts integrating school-administration and learning systems, plus prefecture-scale school-administration builds. University science-faculty expansions and school rebuilds added more.
The other three segments went sideways or backwards
Information Systems, the largest by revenue, grew 11.3% to ¥204,447 million but its profit fell 6.5% to ¥4,293 million. Large visualisation projects and a Windows 10 end-of-support wave in the first quarter helped the top line, and cloud subscription licences kept growing; against that, the higher-margin SI work for small and mid-sized companies was pushed back by semiconductor-driven delays in server and PC supply.
Office revenue slipped 0.4% to ¥59,172 million against a large prior-year project, though profit rose 7.3% to ¥2,132 million on an overseas recovery and better profitability in adjacent businesses. Other — training and staffing — fell 10.2% in revenue to ¥1,071 million and 39.9% in profit to ¥174 million.
Cash flow, a five-for-one split, and guidance that reverses the year
Total assets rose 7.0% to ¥187,176 million and net assets 21.4% to ¥85,982 million, taking the equity ratio to 45.8% from 40.3%. Operating cash flow was the standout: ¥13,069 million against ¥549 million a year earlier, helped by a ¥6,784 million rise in contract liabilities and a ¥2,348 million fall in inventories. Investing cash flow was −¥1,331 million and financing −¥3,466 million, leaving cash of ¥31,364 million against ¥23,071 million.
Guidance for FY7/2027 points the other way on every line: net sales of ¥400,000 million (−6.0%), operating profit of ¥15,000 million (−4.0%), ordinary profit of ¥16,000 million (−4.6%) and net profit of ¥10,500 million (−15.9%), for earnings per share of ¥212.89. The company is, in other words, treating this year's public-sector surge as the peak rather than a new base.
On the dividend, read the two years on the same basis. The company carried out a five-for-one stock split effective January 21, 2026, so the ¥76.00 year-end dividend for FY7/2026 is stated after the split and is not comparable with the ¥300.00 paid for FY7/2025, which is the pre-split actual. On the old share count ¥76.00 equals ¥380.00, so the real move is ¥300.00 to ¥380.00; total dividends paid rose from ¥2,957 million to ¥3,750 million, which is the same 26.8% increase. The FY7/2027 forecast is ¥76.00 again, a 35.7% payout ratio on the lower guided profit.
| Metric | FY7/2026 | FY7/2025 | Change |
|---|---|---|---|
| Net sales (¥ million) | 425,729 | 337,055 | +26.3% |
| Gross profit (¥ million) | 59,240 | 52,387 | +13.1% |
| SG&A expenses (¥ million) | 43,609 | 40,213 | +8.4% |
| Operating profit (¥ million) | 15,631 | 12,174 | +28.4% |
| Operating margin | 3.7% | 3.6% | +0.1 pt |
| Ordinary profit (¥ million) | 16,770 | 13,126 | +27.8% |
| Net profit (¥ million) | 12,486 | 9,825 | +27.1% |
| EPS (¥) | 253.23 | 199.45 | +27.0% |
| Public Sector — revenue (¥ million) | 161,038 | 92,781 | +73.6% |
| Public Sector — segment profit (¥ million) | 8,974 | 5,240 | +71.2% |
| Office — revenue (¥ million) | 59,172 | 59,419 | −0.4% |
| Office — segment profit (¥ million) | 2,132 | 1,987 | +7.3% |
| Information Systems — revenue (¥ million) | 204,447 | 183,661 | +11.3% |
| Information Systems — segment profit (¥ million) | 4,293 | 4,591 | −6.5% |
| Other — revenue (¥ million) | 1,071 | 1,192 | −10.2% |
| Other — segment profit (¥ million) | 174 | 290 | −39.9% |
| Total assets (¥ million) | 187,176 | 174,917 | +7.0% |
| Net assets (¥ million) | 85,982 | 70,805 | +21.4% |
| Equity ratio | 45.8% | 40.3% | +5.5 pt |
| FY7/2027 guidance — revenue (¥ million) | 400,000 | — | −6.0% |
| FY7/2027 guidance — operating profit (¥ million) | 15,000 | — | −4.0% |
| FY7/2027 guidance — ordinary profit (¥ million) | 16,000 | — | −4.6% |
| FY7/2027 guidance — net profit (¥ million) | 10,500 | — | −15.9% |
| FY7/2027 guidance — EPS (¥) | 212.89 | — | n.m. |
| Annual dividend per share (¥) | 76.00 | 300.00 | n.m. |
JapanStockPulse provides informational content only and does not constitute investment advice. Figures are taken from the company's published earnings short report and may be subject to subsequent revision.