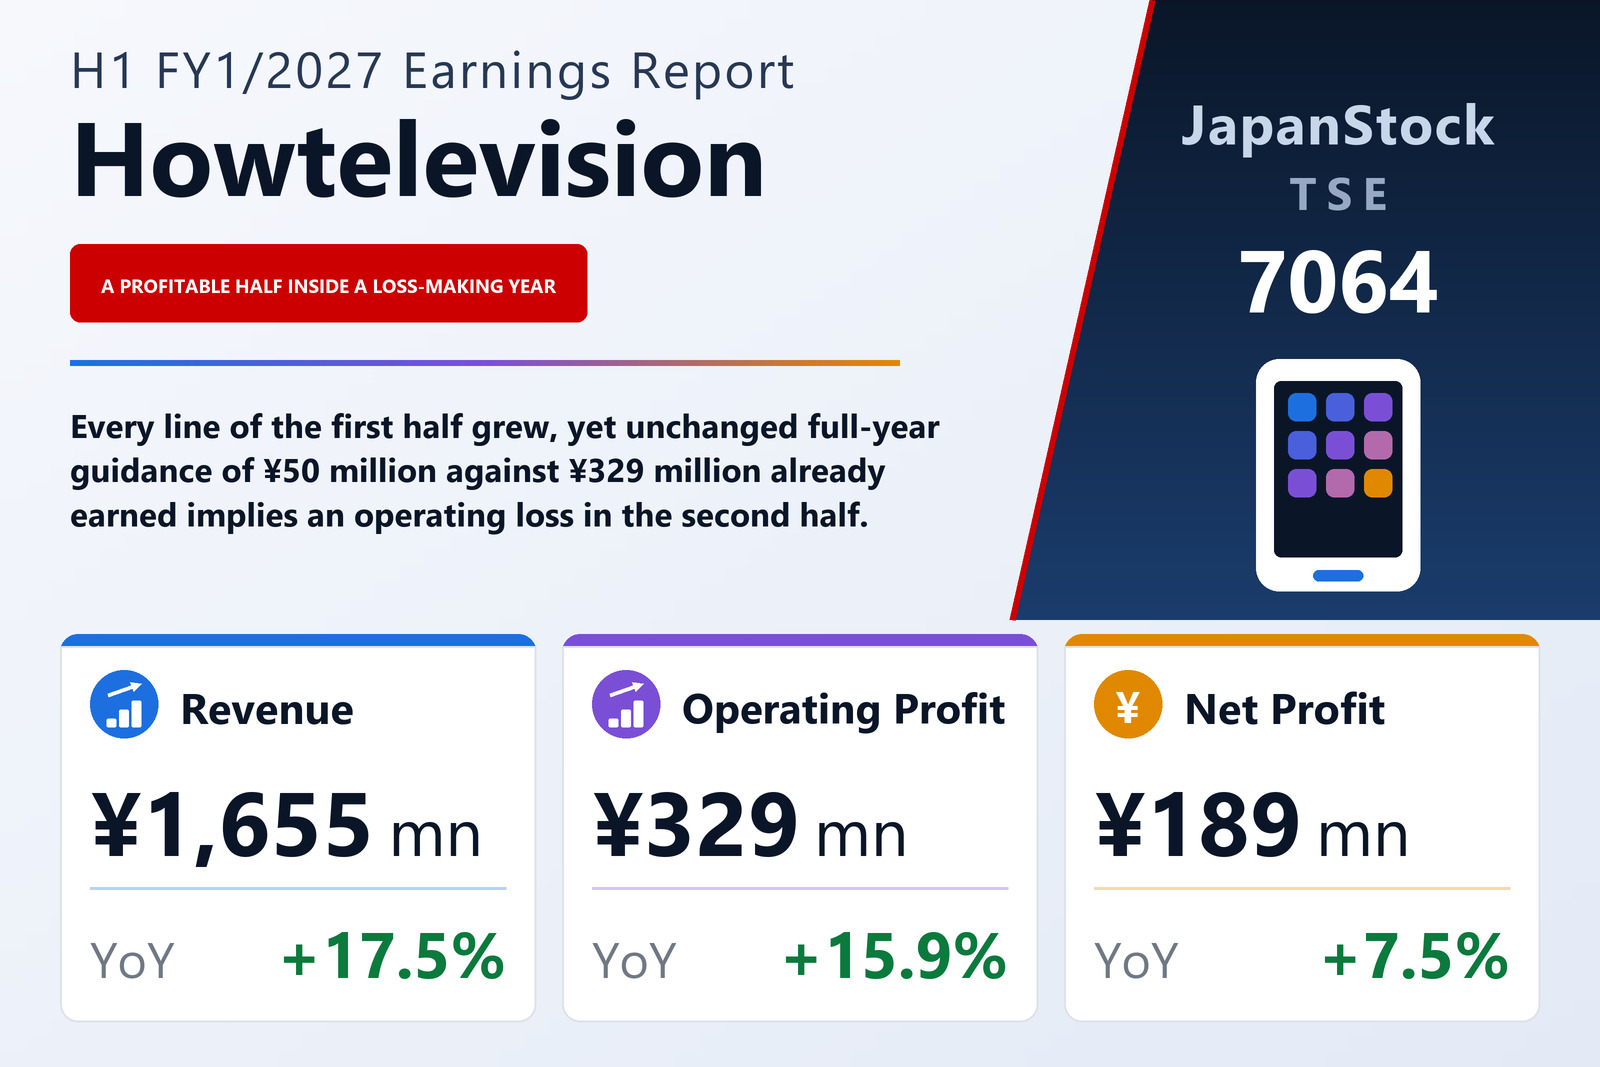
Every line of the first half grew
Howtelevision, Inc. (TSE: 7064), which runs the Gaishishukatsu.com career platform for high-achieving students, published consolidated results for the six months to July 31, 2026 on September 9, 2026 under Japanese GAAP. Revenue rose 17.5% to ¥1,655 million, gross profit 18.7% to ¥1,378 million, operating profit 15.9% to ¥329 million, ordinary profit 14.2% to ¥321 million and profit attributable to owners of the parent 7.5% to ¥189 million. Comprehensive income was ¥192 million, up 9.3%, and earnings per share ¥69.59 against ¥64.67.
The shape of that growth is worth reading. Cost of sales rose only 12.1%, to ¥276 million, so the gross margin widened 0.8 point to 83.3% — but selling, general and administrative expenses rose 19.6% to ¥1,049 million, faster than the 17.5% revenue line, and the operating margin therefore narrowed 0.3 point to 19.9%. Below the operating line, income taxes rose 26.6% to ¥132 million, which is why the bottom line grew 7.5% while operating profit grew 15.9%.
Unchanged guidance implies a loss-making second half
The company left full-year FY1/2027 guidance exactly as it was: revenue of ¥3,100 million (+21.2%), operating profit of ¥50 million (−80.1%), ordinary profit of ¥38 million (−84.7%), net profit of ¥27 million (−72.0%) and earnings per share of ¥9.94. Set against the ¥329 million of operating profit already booked in the first half, that guide is arithmetic for an operating loss of roughly ¥279 million in the six months to January 2027 — and, on the same subtraction, an ordinary loss of about ¥283 million and a net loss of about ¥162 million.
The filing does not publish a line-by-line bridge to that second half. What it does describe is spending: hiring highly specialised staff, and marketing to acquire respondents for mond, its question-and-answer service, which it has also begun taking into English-speaking markets. The size of the implied loss is the company's own two numbers subtracted, not a figure the company has itself explained.
New-graduate services carried the growth
Howtelevision reports a single segment, the Platform business, so the filing carries no segment disclosure. It does break out one line: revenue from new-graduate services rose 20.1% to ¥1,428 million, faster than the group's 17.5% and accounting for most of the increase. The mid-career service Liiga, the recruitment-process-outsourcing line and mond are not given separate revenue figures, and none should be inferred. Group KPIs at the half-year end were 1,112 cumulative client companies, 24 more than at the fiscal year-end, and 767,973 cumulative members, up 62,498.
The half's initiatives were mostly product and event work: the full rollout of the integrated management tool Shukatsu Copilot and the launch of AI interview preparation within its AI selection-preparation series; Meetup and Expo events, including an engineer hackathon co-hosted with Mercari; and in April a fully vetted social-dining service, LYMiN. In mid-career, the company cites integrating the member base with Gaishishukatsu.com and higher placement fees; in recruitment process outsourcing, an award at the Tenshoku Draft AWARD run by Livesense's mid-career service.
The balance sheet grew 27% on an accounting change, not on borrowing
Total assets rose 26.9% to ¥3,429 million, and almost all of that came from one decision. Fixed assets rose ¥815 million, of which ¥748 million was right-of-use assets recognised on early adoption of the new lease accounting standard. Property, plant and equipment excluding those assets rose ¥82 million on a head office relocation, and software ¥21 million, while deferred tax assets fell ¥17 million. Current assets fell ¥87 million to ¥1,746 million, as cash and deposits rose ¥20 million but accounts receivable fell ¥87 million.
The same standard drives the liability side. Non-current liabilities rose ¥566 million, of which lease liabilities accounted for ¥592 million, with asset retirement obligations up ¥41 million and long-term borrowings down ¥68 million on repayment. Current liabilities fell ¥44 million, with lease liabilities up ¥192 million and contract liabilities up ¥141 million against a ¥420 million fall in accrued expenses. Net assets rose ¥206 million to ¥1,637 million on ¥188 million of retained earnings and ¥15 million of share subscription rights. The equity ratio fell from 52.3% to 46.8% — mostly a standard grossing up both sides of the balance sheet, not added leverage.
No dividend, a share split, and one subsidiary out of the group
The dividend is ¥0.00 at every point: no interim and no year-end, in the prior year and in the current forecast, with no revision. Per-share figures are comparable year on year because a 2-for-1 common-share split carried out on August 1, 2025 is applied as if it had occurred at the start of the prior fiscal year — earnings per share of ¥69.59 against ¥64.67, and diluted earnings per share of ¥67.70 against ¥64.21, are therefore like-for-like. One subsidiary, Logrio Inc., left the scope of consolidation during the half, and the early adoption of the lease standard is recorded as an accounting-policy change other than a standards revision.
The hiring market it sells into
The filing sets out its own backdrop. Japan's job-openings-to-applicants ratio was 1.18 times in June 2026 against 1.22 a year earlier, on labour ministry data, and unemployment was 2.5%, unchanged year on year — a market still tilted toward job seekers. For the class of 2028, company hiring schedules are moving earlier and internships are expanding, pulling job-hunting forward with them. And on the company's own survey, nearly 40% of students now use generative AI as a job-hunting information tool, which is the demand the AI products described above are aimed at.
| Metric | H1 FY1/2027 | H1 FY1/2026 | Change |
|---|---|---|---|
| Revenue (¥ million) | 1,655 | 1,408 | +17.5% |
| Gross profit (¥ million) | 1,378 | 1,162 | +18.7% |
| Gross margin | 83.3% | 82.5% | +0.8 pt |
| SG&A expenses (¥ million) | 1,049 | 878 | +19.6% |
| Operating profit (¥ million) | 329 | 284 | +15.9% |
| Operating margin | 19.9% | 20.2% | −0.3 pt |
| Ordinary profit (¥ million) | 321 | 281 | +14.2% |
| Pre-tax profit (¥ million) | 321 | 280 | +14.6% |
| Net profit attrib. to owners of parent (¥ million) | 189 | 176 | +7.5% |
| Comprehensive income (¥ million) | 192 | 176 | +9.3% |
| EPS (¥) | 69.59 | 64.67 | +7.6% |
| Diluted EPS (¥) | 67.70 | 64.21 | +5.4% |
| Total assets (¥ million) | 3,429 | 2,701 | +26.9% |
| Net assets (¥ million) | 1,636 | 1,430 | +14.4% |
| Equity attrib. to owners of parent (¥ million) | 1,604 | 1,414 | +13.4% |
| Equity ratio | 46.8% | 52.3% | −5.5 pt |
| FY1/2027 guidance — revenue (¥ million) | 3,100 | — | +21.2% |
| FY1/2027 guidance — operating profit (¥ million) | 50 | — | −80.1% |
| FY1/2027 guidance — ordinary profit (¥ million) | 38 | — | −84.7% |
| FY1/2027 guidance — net profit (¥ million) | 27 | — | −72.0% |
| FY1/2027 guidance — EPS (¥) | 9.94 | — | n.m. |
| Annual dividend per share (¥) | 0.00 | 0.00 | unchanged |
JapanStockPulse provides informational content only and does not constitute investment advice. Figures are taken from the company's published earnings short report and may be subject to subsequent revision.