A first consolidated year, so there is nothing to compare it with
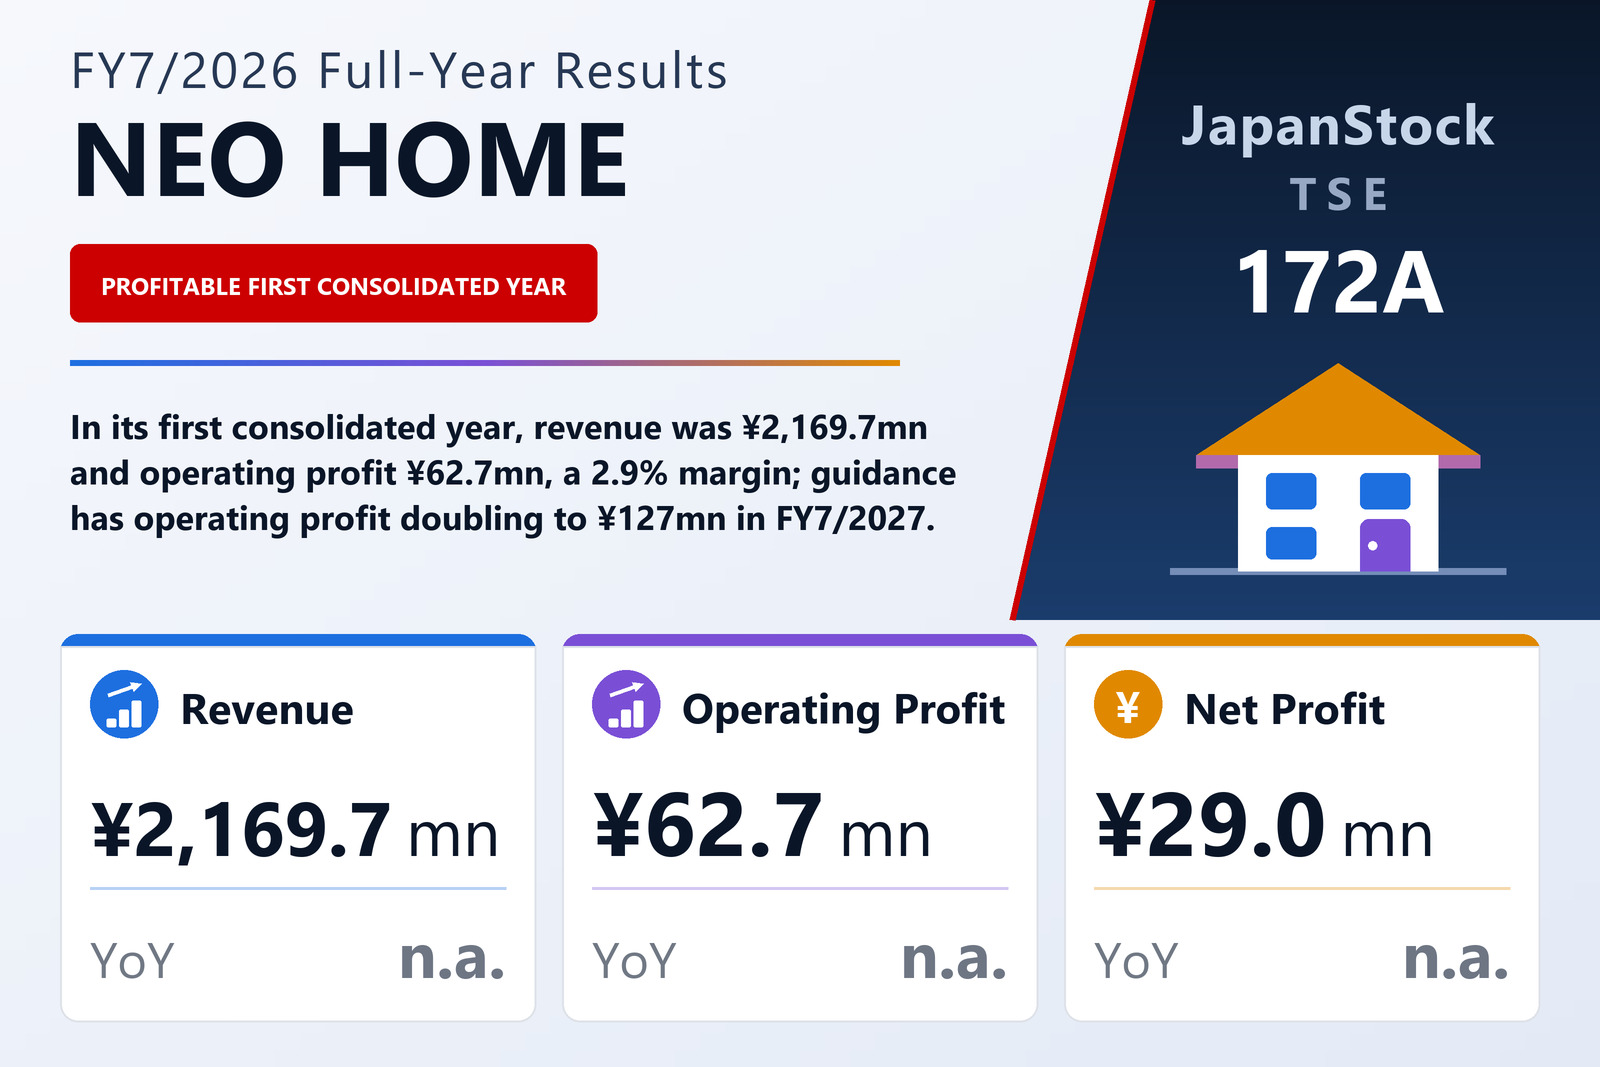
NEO HOME Co., Ltd. (TSE: 172A), a Kumamoto-based homebuilder listed on the Tokyo Stock Exchange's TOKYO PRO Market, published consolidated results for the fiscal year from August 1, 2025 to July 31, 2026 on September 10, 2026, under Japanese GAAP. Revenue was ¥2,169.7 million, operating profit ¥62.7 million, ordinary profit ¥48.3 million and profit attributable to owners of the parent ¥29.0 million, or ¥145.08 per share on 200,000 shares. The company holds its annual general meeting on October 26, 2026, and schedules its annual Issuer Information report for the same day.
The reason there are no growth rates is structural. NEO HOME set up a subsidiary in May 2026 and moved to consolidated accounts from this fiscal year; because it prepared no consolidated statements for FY7/2025, the filing prints no prior-year results and no year-on-year percentages, and says plainly that it has not analysed the year against the previous one. For the same reason, the stated return on equity of 9.6% and ordinary return on assets of 3.4% are calculated on year-end rather than average balances. What follows therefore reads the year on its own arithmetic.
An 18.3% gross margin, most of it spent before the operating line
Cost of sales was ¥1,772.5 million, leaving gross profit of ¥397.2 million, a gross margin of 18.3%. Revenue came in two lines. Completed construction contracts brought in ¥1,551.2 million, 71.5% of the total, at a cost of ¥1,246.7 million, a gross margin of 19.6%; sales from other businesses brought in ¥618.5 million at a cost of ¥525.8 million, a margin of 15.0%. Selling, general and administrative expenses of ¥334.5 million, 15.4% of revenue, absorbed 84% of gross profit, which is why a business with an 18.3% gross margin earned an operating margin of only 2.9%.
The filing's own account of the year runs as follows. In the construction business, NEO HOME opened a Fukuoka sales office and extended its sales area beyond Kumamoto Prefecture; new orders rose and results ran above the initial plan. In its other businesses, deliveries of built-for-sale apartment buildings were completed and contributed to results. Those two lifted revenue, but because the split of sales between the detached-housing and construction businesses moved away from the original assumption, the gross margin came in below plan, and higher personnel costs from staffing up the construction business for future orders also weighed on profit. The filing does not quantify the plan or either effect. The group reports a single construction segment, so there is no segment breakdown. The company describes its market as difficult, with building-material prices staying high, labour costs rising, and buyers cautious as house prices climb and attention turns to interest rates.
Interest took more than a quarter of operating profit
Below the operating line, non-operating income of ¥5.1 million — subsidy income of ¥1.4 million, cancellation fees of ¥1.3 million, insurance proceeds of ¥0.8 million and grants of ¥0.7 million — was outweighed by non-operating expenses of ¥19.6 million, of which interest was ¥17.5 million, equal to 28% of operating profit, and guarantee fees ¥1.3 million. Ordinary profit was therefore ¥48.3 million, a 2.2% margin. A gain of ¥0.5 million on the sale of fixed assets and a loss of ¥0.65 million on their disposal left pre-tax profit at ¥48.2 million. Income taxes of ¥19.2 million — current taxes of ¥23.3 million less a deferred-tax credit of ¥4.2 million — were an effective rate of 39.8%, leaving net profit of ¥29.0 million, 1.3% of revenue. There are no non-controlling interests, and comprehensive income equals net profit.
Half the balance sheet is property held for sale
Total assets were ¥1,431.0 million at July 31, 2026, of which current assets were ¥1,239.6 million. Real estate for sale of ¥577.4 million and real estate for sale in progress of ¥167.2 million together came to ¥744.6 million, or 52% of total assets; cash and deposits were ¥249.0 million and contract assets ¥117.0 million. On the other side, liabilities were ¥1,128.7 million. Short-term borrowings of ¥555.1 million, long-term borrowings of ¥205.0 million plus a current portion of ¥48.7 million, and bonds of ¥15.0 million plus ¥10.0 million due within a year add up to ¥833.8 million of borrowings and bonds, 2.8 times net assets. Net assets were ¥302.3 million — capital of ¥20.0 million and retained earnings of ¥282.3 million — for an equity ratio of 21.1% and net assets per share of ¥1,511.45. They rose from ¥273.3 million at the start of the year, and the year's profit is the entire movement.
Cash came in as inventory ran down, and went out to repay debt
Operating cash flow was ¥134.1 million, 4.6 times net profit. Pre-tax profit of ¥48.2 million, depreciation of ¥25.1 million and a ¥119.9 million decrease in inventories were the main inflows, set against a ¥66.4 million fall in payables and a ¥39.9 million rise in receivables. Investing activities used ¥22.6 million, chiefly ¥12.4 million placed in time deposits, ¥4.4 million on property, plant and equipment and ¥4.0 million in deposits and guarantees, leaving free cash flow of about ¥111.5 million. Financing used ¥88.5 million: short-term borrowings fell by a net ¥195.5 million, long-term loans of ¥53.9 million were repaid and ¥20.0 million of bonds redeemed, against ¥183.9 million of new long-term borrowing. Part of the short-term funding was thus moved into long-term loans, and loans and bonds together fell by about ¥85.5 million. Cash and cash equivalents rose ¥23.0 million to ¥209.6 million from ¥186.6 million. The inventory release that drove this year's cash flow is not a recurring source: the company says it will keep acquiring land and selling built-for-sale homes.
Guidance has operating profit doubling on 15.5% more revenue
For FY7/2027 NEO HOME forecasts revenue of ¥2,505 million (+15.5%), operating profit of ¥127 million (+103.1%), ordinary profit of ¥94 million (+96.5%) and net profit attributable to owners of ¥62 million (+115.6%), or ¥312.87 per share. That implies an operating margin of about 5.1% against 2.9% this year. The gap between guided operating and ordinary profit, about ¥33 million, is also wider than this year's ¥14.4 million, so the forecast assumes higher net non-operating costs; the filing does not break them down. The plan behind the numbers: in detached housing, the main business, the company will concentrate on winning custom-build contracts while continuing to acquire land and sell built-for-sale homes, and expects the new subsidiary to open further sales channels; in construction, it will use its two bases in Kumamoto and Fukuoka to win orders inside and outside Kumamoto Prefecture; and in its other businesses, citing the clustering of semiconductor-related companies and capital investment in Kumamoto Prefecture, it will keep building and selling apartment buildings while watching property demand. It expects the housing market to stay uncertain, pointing to price rises weighing on households, interest rates and building costs.
No dividend was paid for FY7/2025 or FY7/2026, and none is forecast for FY7/2027; the filing gives no reason. The share count was unchanged at 200,000, with no treasury stock and no dilutive shares.
| Metric | FY7/2026 | FY7/2025 | Change |
|---|---|---|---|
| Revenue (¥ million) | 2,169 | — | — |
| Revenue — completed construction contracts (¥ million) | 1,551 | — | — |
| Revenue — other businesses (¥ million) | 618 | — | — |
| Gross profit (¥ million) | 397 | — | — |
| Gross margin | 18.3% | — | — |
| SG&A expenses (¥ million) | 334 | — | — |
| Operating profit (¥ million) | 62 | — | — |
| Operating margin | 2.9% | — | — |
| Ordinary profit (¥ million) | 48 | — | — |
| Net profit attrib. to owners of parent (¥ million) | 29 | — | — |
| EPS (¥) | 145.08 | — | — |
| Total assets (¥ million) | 1,431 | — | — |
| Net assets (¥ million) | 302 | — | — |
| Equity ratio | 21.1% | — | — |
| Borrowings and bonds (¥ million) | 833 | — | — |
| Operating cash flow (¥ million) | 134 | — | — |
| Investing cash flow (¥ million) | −22 | — | — |
| Financing cash flow (¥ million) | −88 | — | — |
| Cash and equivalents at period end (¥ million) | 209 | — | — |
| FY7/2027 guidance — revenue (¥ million) | 2,505 | — | +15.5% |
| FY7/2027 guidance — operating profit (¥ million) | 127 | — | +103.1% |
| FY7/2027 guidance — ordinary profit (¥ million) | 94 | — | +96.5% |
| FY7/2027 guidance — net profit (¥ million) | 62 | — | +115.6% |
| FY7/2027 guidance — EPS (¥) | 312.87 | — | — |
| Annual dividend per share (¥) | 0.00 | 0.00 | unchanged |
JapanStockPulse provides informational content only and does not constitute investment advice. Figures are taken from the company's published earnings short report and may be subject to subsequent revision.