An operating loss became a profit on lower costs, not on faster sales
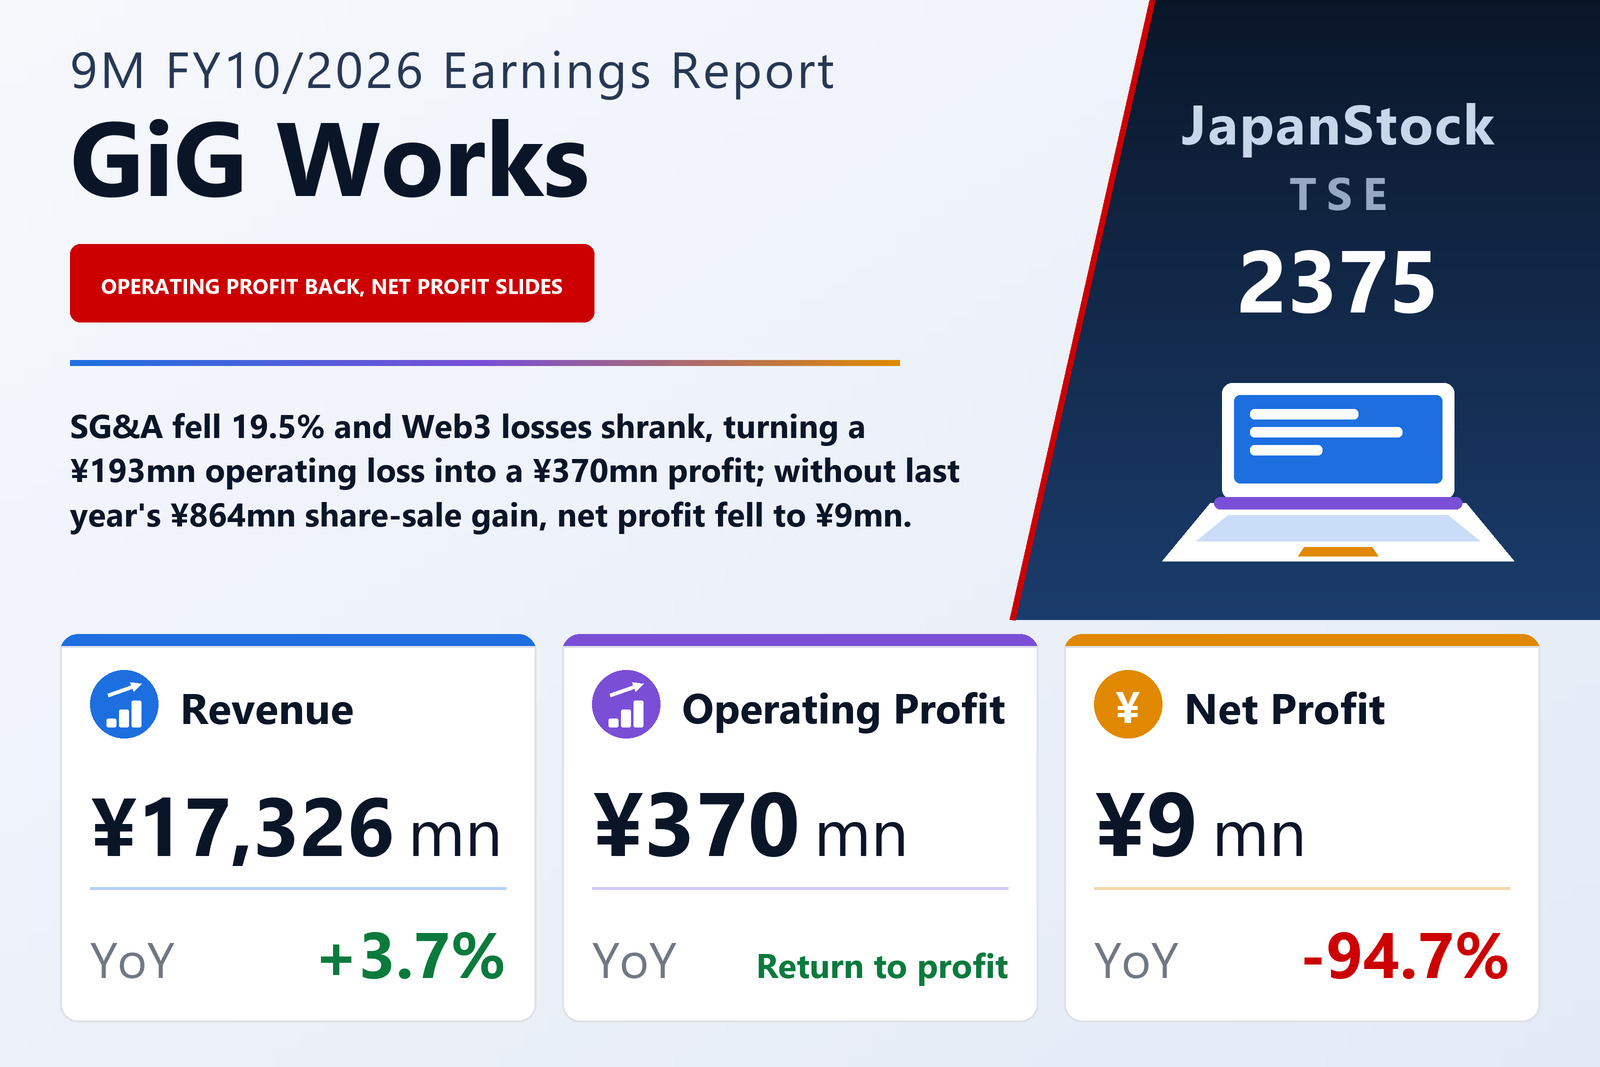
GiG Works Inc. (TSE: 2375), which runs the “GiGWorks Basic” platform through which gig workers and client companies place and take on work directly, published consolidated results for the first nine months of its fiscal year ending October 2026 — November 1, 2025 to July 31, 2026 — on September 10, 2026, under Japanese GAAP. Revenue rose 3.7% to ¥17,326 million. Operating profit was ¥370 million against a loss of ¥193 million a year earlier, and ordinary profit ¥160 million against a loss of ¥284 million. Profit attributable to owners of the parent fell 94.7% to ¥9 million from ¥185 million, or ¥0.50 per share against ¥9.35. The company is listed on the Tokyo Stock Exchange.
The turnaround did not come from the gross line. Cost of sales rose 6.2% to ¥13,824 million, faster than revenue, so gross profit fell 5.3% to ¥3,502 million and the gross margin narrowed from 22.1% to 20.2%. What moved was selling, general and administrative expenses, which fell 19.5%, or ¥760 million, to ¥3,131 million. Set against a ¥195 million fall in gross profit, that cut produced the whole ¥564 million swing at the operating line, and the operating margin went from −1.2% to 2.1%. The filing does not break SG&A down and does not explain the lower gross margin. It does show that the prior-year period still contained Nihon Chokuhan, a subsidiary whose shares were all sold on April 1, 2025, and whose Digital Marketing segment — now abolished — recorded revenue of ¥1,292 million and a segment loss of ¥163 million up to the date it left the group. Taking that business's external sales out of the prior period, the four continuing segments' external sales rose about 12.4%, from ¥15,417 million to ¥17,326 million.
Below the operating line: a bigger crypto write-down, and no repeat of last year's one-offs
Non-operating income slipped to ¥25 million from ¥40 million, while non-operating expenses rose 80.9% to ¥236 million. Almost all of that was a ¥213 million valuation loss on crypto assets, double the ¥106 million of a year earlier, which the company says arose mainly from revaluing the crypto assets the group holds at their market price on the last day of the period. The filing adds that the loss was only ¥4 million larger than at the half-year stage, so nearly all of it had already been booked in the first half. Interest expense rose to ¥21 million from ¥17 million. Ordinary profit therefore came in at ¥160 million, well under half the operating figure.
The extraordinary lines explain the fall at the bottom. A year earlier, extraordinary income of ¥876 million included an ¥864 million gain on the sale of shares in affiliates, against extraordinary losses of ¥323 million that included a ¥300 million loss on debt forgiveness. This year extraordinary income was only ¥42 million, chiefly ¥40 million of penalty income, against ¥5 million of losses on retiring fixed assets. Pre-tax profit therefore fell 26.8% to ¥197 million, while income taxes more than doubled to ¥187 million — about 95% of pre-tax profit — leaving net profit of ¥10 million, of which ¥9 million is attributable to owners of the parent after ¥0.3 million to non-controlling interests. Comprehensive income was ¥14 million against ¥180 million.
On-Demand grows, Web3 nearly breaks even, and Sharing Economy laps a property sale
On-Demand Economy, the largest segment, grew revenue 17.9% to ¥9,048 million and segment profit 56.2% to ¥661 million. The company says 3,071 unique workers were active nationwide in the period. Field services took in demand from Windows replacements, GIGA School projects, survey work and tablet-POS projects, and began drone pesticide spraying in six prefectures; direct business with major corporate groups advanced in tablet-POS support and Windows replacements. In the contact centre, which the company runs as a hybrid of people and AI, better revenue efficiency, new projects and growth in lifestyle-support and technical-support work lifted profit. External sales of field support and marketing services rose to ¥3,633 million from ¥2,512 million, and of contact-centre services to ¥5,356 million from ¥5,099 million, although the filing notes that its segment and service categories were changed from the first quarter. The segment also took in spacetimes, an event-planning and merchandise company whose projects include idol groups such as Nogizaka46 and Hinatazaka46; it became a subsidiary in December 2025 and added ¥257 million of goodwill.
Web3 Services grew revenue 556.3% to ¥347 million from ¥52 million and cut its segment loss to ¥25 million from ¥527 million — a ¥502 million improvement that was the largest single contributor to the group's turnaround. The segment builds blockchain-based apps: the SNPIT app developed by GALLUSYS has its own SNPIT Token (SNPT), traded on a domestic crypto exchange, and from this period the segment also began planning, consulting on and delivering AI-talent training programmes, which the company says contributed to revenue. System Solutions grew revenue 17.3% to ¥4,155 million as contract development and system-engineering services expanded with partners and several contract projects were won, but segment profit fell 9.0% to ¥552 million; the filing does not say why.
Sharing Economy revenue fell 7.7% to ¥4,315 million and segment profit 48.9% to ¥292 million, because the prior-year period included revenue from the completion of a property sale; the filing does not quantify it, and says the share offices and specialty salons themselves performed very well. The THE HUB share-office brand opened in Meguro in July 2026, taking it to 81 sites and 1,800 workspaces, and membership rose to 28,200 on stronger web marketing and a revamp to nine contract plans; the nex the salon chain, staffed by gig-worker stylists, opened in Shibuya in January 2026 and now has six salons. External sales of share offices and related services were ¥3,503 million against ¥3,741 million, and of building management and fit-out work ¥578 million against ¥558 million. Across the group, segment profit totalled ¥1,480 million against ¥911 million, while corporate costs and eliminations were almost unchanged at ¥1,109 million against ¥1,104 million — so the whole operating turnaround is visible in the segments.
Cash fell ¥691 million, and goodwill rose with the spacetimes deal
Total assets rose 1.6% to ¥7,933 million from ¥7,812 million at October 31, 2025. Cash and deposits fell ¥691 million to ¥1,816 million, while trade receivables and contract assets rose ¥505 million to ¥2,854 million and goodwill rose ¥232 million to ¥246 million. On the other side, accounts payable rose ¥192 million and the current portion of long-term borrowings ¥85 million, while long-term borrowings fell ¥35 million; short-term borrowings were unchanged at ¥1,100 million. Net assets fell 2.9% to ¥2,716 million, chiefly because capital surplus fell ¥64 million when the company bought a further 12.9% of spacetimes from non-controlling shareholders on June 26, 2026 for ¥64 million in cash, taking its voting stake to 64.6%. The equity ratio slipped from 34.6% to 33.1%. No cash-flow statement was prepared for the period; depreciation was ¥289 million and goodwill amortisation ¥25 million.
Guidance unchanged, and it asks very little of the fourth quarter at the operating line
GiG Works left its full-year FY10/2026 guidance, published on June 11, 2026, unchanged: revenue of ¥23,000 million (+3.3%), operating profit of ¥400 million, ordinary profit of ¥180 million and profit attributable to owners of the parent of ¥50 million (−81.6%), or ¥2.51 per share. Nine months have delivered 75.3% of guided revenue but 92.7% of guided operating profit and 88.9% of guided ordinary profit, which implies a fourth quarter of about ¥5,673 million of revenue, only about ¥29 million of operating profit and about ¥20 million of ordinary profit. Net profit is the exception: the ¥9 million booked is under a fifth of the ¥50 million guided, so the plan needs about ¥40 million in the last quarter. The filing gives no quarterly breakdown and does not comment on that shape.
The dividend forecast is also unchanged, at a ¥2.00 year-end dividend, the same as last year; on guided earnings of ¥2.51 per share, that is a payout of roughly 80%. The company describes the Japanese economy as recovering moderately, with the outlook clouded by continuing inflation, swings in currency and financial markets, U.S. trade policy and rising geopolitical risk, and it frames its business around a structural labour shortage that it says makes platforms such as its own more important.
| Metric | 9M FY10/2026 | 9M FY10/2025 | Change |
|---|---|---|---|
| Revenue (¥ million) | 17,326 | 16,712 | +3.7% |
| Gross profit (¥ million) | 3,502 | 3,697 | −5.3% |
| Gross margin | 20.2% | 22.1% | −1.9 pt |
| SG&A expenses (¥ million) | 3,131 | 3,891 | −19.5% |
| Operating profit (¥ million) | 370 | −193 | loss to profit |
| Operating margin | 2.1% | −1.2% | +3.3 pt |
| Non-operating expenses (¥ million) | 236 | 130 | +80.9% |
| Valuation loss on crypto assets (¥ million) | 213 | 106 | +100.0% |
| Ordinary profit (¥ million) | 160 | −284 | loss to profit |
| Extraordinary income (¥ million) | 42 | 876 | −95.1% |
| Pre-tax profit (¥ million) | 197 | 269 | −26.8% |
| Income taxes (¥ million) | 187 | 89 | +108.7% |
| Net profit attrib. to owners of parent (¥ million) | 9 | 185 | −94.7% |
| EPS (¥) | 0.50 | 9.35 | −94.7% |
| Comprehensive income (¥ million) | 14 | 180 | −92.1% |
| On-Demand Economy — revenue (¥ million) | 9,048 | 7,676 | +17.9% |
| On-Demand Economy — segment profit (¥ million) | 661 | 423 | +56.2% |
| Web3 Services — revenue (¥ million) | 347 | 52 | +556.3% |
| Web3 Services — segment profit (¥ million) | −25 | −527 | loss narrowed |
| System Solutions — revenue (¥ million) | 4,155 | 3,541 | +17.3% |
| System Solutions — segment profit (¥ million) | 552 | 607 | −9.0% |
| Sharing Economy — revenue (¥ million) | 4,315 | 4,673 | −7.7% |
| Sharing Economy — segment profit (¥ million) | 292 | 571 | −48.9% |
| Digital Marketing (divested) — revenue (¥ million) | — | 1,292 | — |
| Digital Marketing (divested) — segment profit (¥ million) | — | −163 | — |
| Total assets (¥ million) | 7,933 | 7,812 | +1.6% |
| Cash and deposits (¥ million) | 1,816 | 2,508 | −27.6% |
| Net assets (¥ million) | 2,716 | 2,797 | −2.9% |
| Equity ratio | 33.1% | 34.6% | −1.5 pt |
| FY10/2026 guidance — revenue (¥ million) | 23,000 | — | +3.3% |
| FY10/2026 guidance — operating profit (¥ million) | 400 | — | n.m. |
| FY10/2026 guidance — ordinary profit (¥ million) | 180 | — | n.m. |
| FY10/2026 guidance — net profit (¥ million) | 50 | — | −81.6% |
| FY10/2026 guidance — EPS (¥) | 2.51 | — | — |
| Annual dividend per share (¥) | 2.00 | 2.00 | unchanged |
JapanStockPulse provides informational content only and does not constitute investment advice. Figures are taken from the company's published earnings short report and may be subject to subsequent revision.