Revenue rose 5.9%, operating profit 5.5% — and the margin stood still
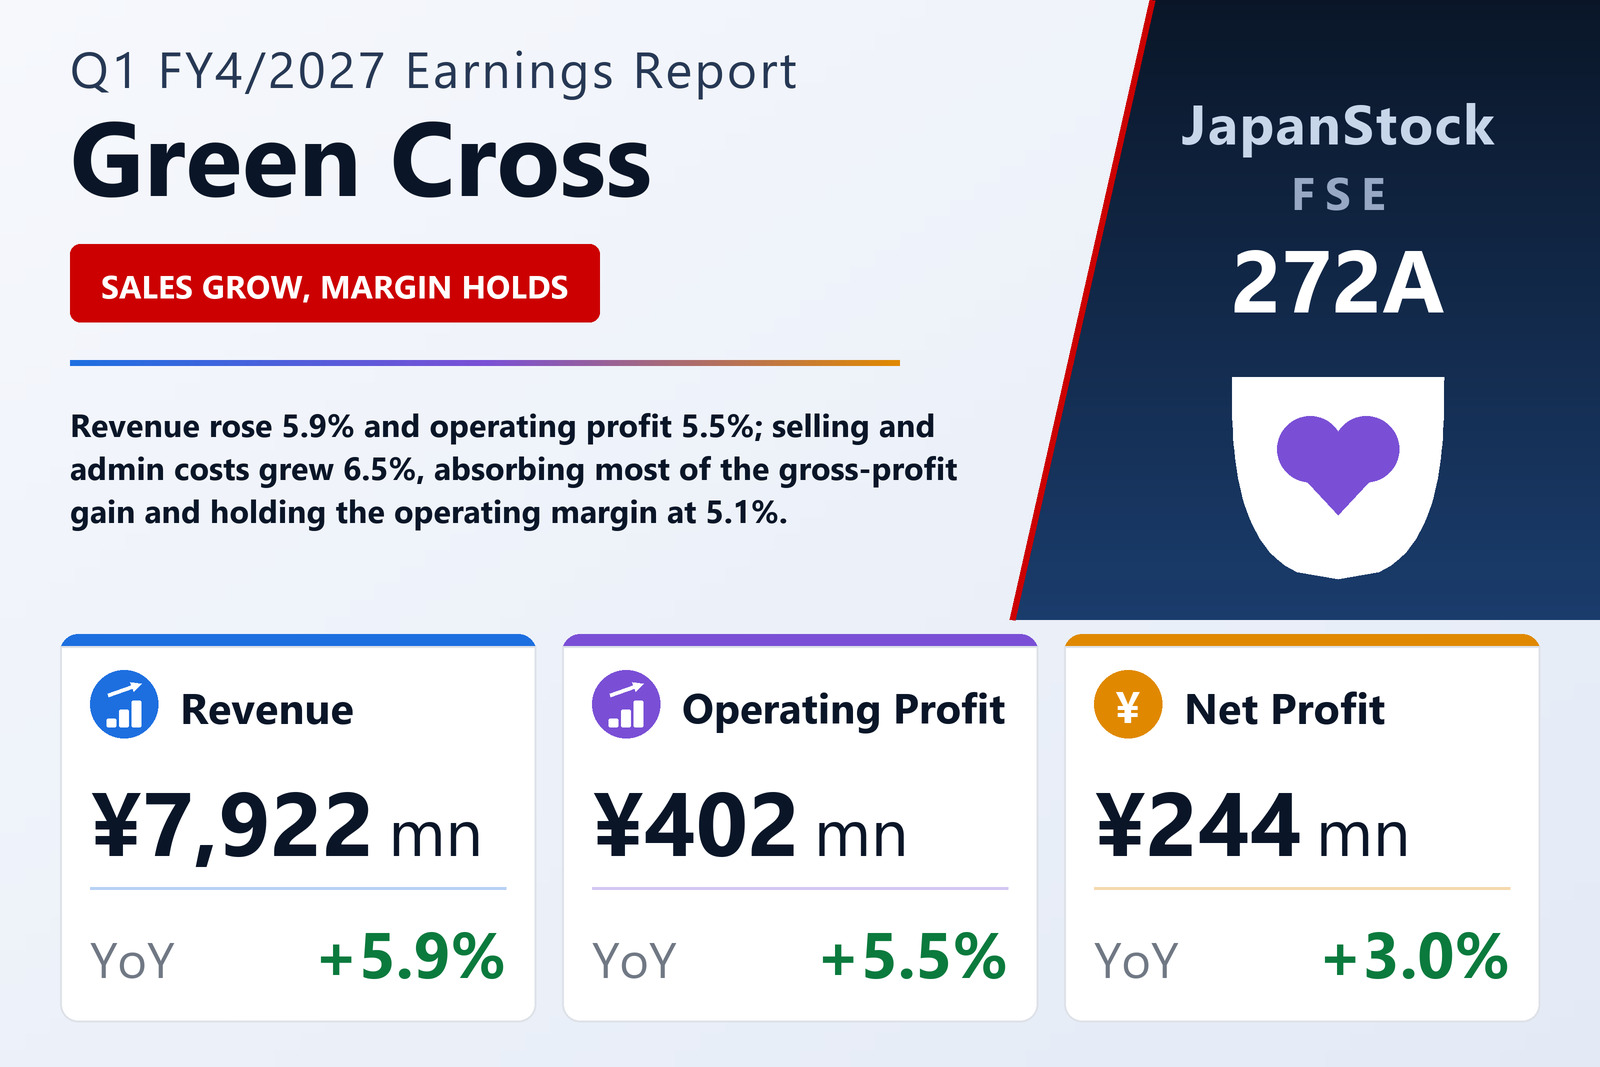
Green Cross Holdings Co., Ltd. (FSE: 272A), the Fukuoka-based group that makes, sells and rents road-safety materials, building disaster-prevention goods, safety supplies, protective equipment and signs, published consolidated results for the first quarter of FY4/2027, the three months from May 1 to July 31, 2026, on September 10, 2026 under Japanese GAAP. Revenue rose 5.9% to ¥7,922 million, operating profit 5.5% to ¥402 million, ordinary profit 7.3% to ¥413 million and profit attributable to owners of the parent 3.0% to ¥244 million, for earnings of ¥29.34 per share against ¥26.65. The company's shares are listed on the Fukuoka Stock Exchange.
The arithmetic is short. Cost of sales rose 5.7% to ¥5,134 million, a shade slower than revenue, so gross profit rose 6.3% to ¥2,788 million and the gross margin edged up from 35.1% to 35.2%. Selling, general and administrative expenses then grew 6.5% to ¥2,385 million, slightly faster than revenue, taking their share of sales from 30.0% to 30.1%. In yen, gross profit rose by ¥166 million and SG&A by ¥145 million, which left operating profit only ¥21 million higher. The operating margin was 5.1% in both quarters — 5.08% against 5.10% before rounding — so the quarter's growth came from a larger revenue base, not from a wider margin.
Lower depreciation did more than the whole operating gain
One line in the notes puts that ¥21 million in proportion. Depreciation, including amortisation of intangible assets other than goodwill, was ¥382 million against ¥403 million, and goodwill amortisation ¥20.8 million against ¥34.7 million — together about ¥34.5 million lower than a year earlier. That fall is larger than the rise in operating profit. Adding both charges back, operating profit before depreciation and goodwill amortisation comes to roughly ¥805 million against ¥819 million, a slight decline. The filing does not say why either charge fell or how they are split between cost of sales and SG&A, and no quarterly cash-flow statement was prepared, so the point rests on these two notes alone.
Below the operating line: more other income, a doubled interest bill
Ordinary profit grew faster than operating profit, 7.3% against 5.5%, because the non-operating balance improved. Non-operating income was ¥44.7 million against ¥21.6 million, lifted mainly by miscellaneous income of ¥31.5 million against ¥6.6 million, plus dividends received of ¥12.9 million against ¥10.7 million. Non-operating expenses also rose, to ¥33.1 million from ¥17.2 million, chiefly because interest expense nearly doubled, to ¥29.9 million from ¥15.4 million; a year-earlier gain of ¥4.3 million on investment partnerships turned into a ¥2.7 million loss. The net non-operating contribution was therefore ¥11.6 million against ¥4.4 million. The filing explains neither the miscellaneous income nor the higher interest.
There were no extraordinary items in either quarter, so pre-tax profit equalled ordinary profit at ¥413 million. Income taxes rose 12.8% to ¥166 million, of which ¥134 million was deferred-tax adjustments, taking the effective rate from 38.3% to 40.2%. Profit for the period was ¥247 million, up 3.9%, and with ¥2.8 million attributable to non-controlling interests against ¥0.7 million, profit attributable to owners of the parent rose 3.0% to ¥244 million. Earnings per share rose faster, 10.1% to ¥29.34, because the average number of shares outstanding fell 6.4%, to 8,336,240 from 8,910,849. Comprehensive income was ¥270 million, up 1.2%.
What the company credits
Green Cross reports a single segment — the manufacture, sale and rental of road-safety materials, building disaster-prevention goods, safety supplies, protective equipment and sign media — so the filing carries no segment breakdown, and it gives no split of the revenue gain by product, customer or price. Its description of the market is the explanation on offer. In the safety and sign-media industries, public investment held firm on national-resilience projects and measures against ageing infrastructure, and private capital spending continued to recover. Against that, labour and logistics costs rose on labour shortages and raw-material and energy prices stayed high — the kind of pressure consistent with SG&A outgrowing revenue, though the filing does not connect the two.
The company says it expanded its environmentally friendly products, pushed IoT products and AI-based products and services, strengthened links across its sales-office network using its logistics function and added rental products. It also promoted SDG-related products, extended its signboard-inspection work over a wider area and sought higher-value services by combining “safety” and “signs”. During the quarter it also brought a new company into the group, with a view to future business development using that company's know-how and resources; the filing gives no terms, does not quantify the company's contribution and reports no significant change in the scope of consolidation.
Balance sheet: less cash, more inventory, more short-term debt
Total assets rose ¥384 million to ¥29,437 million from April 30, 2026. Cash and deposits fell ¥661 million to ¥4,055 million, while notes and accounts receivable rose ¥280 million, merchandise ¥324 million, raw materials and supplies ¥210 million and construction in progress ¥202 million, to ¥328 million. Liabilities rose ¥345 million to ¥17,122 million: short-term borrowings increased ¥625 million to ¥1,585 million, while the provision for bonuses fell ¥446 million and income taxes payable dropped to ¥65 million from ¥434 million.
Net assets rose ¥38 million to ¥12,314 million. Retained earnings fell ¥80 million; the filing does not itemise the movement, but the ¥39.00 year-end dividend for FY4/2026 on roughly 8.3 million shares outstanding at April 30 would come to about ¥325 million, more than the quarter's profit. Treasury stock fell ¥98 million through a disposal of shares, cutting the holding from 700,859 to 628,369 shares, and the valuation difference on securities rose ¥22 million. Because assets grew faster than equity, the equity ratio slipped from 42.1% to 41.6%.
Guidance unchanged: behind on share of the year, on track on growth
Green Cross left its forecasts, published on June 11, 2026, unchanged. For the six months to October 31, 2026 it expects revenue of ¥15,605 million (+4.9%), operating profit of ¥907 million (+5.1%), ordinary profit of ¥897 million (+4.3%) and profit attributable to owners of ¥639 million (+3.8%). For the full year FY4/2027 it expects revenue of ¥31,514 million (+5.6%), operating profit of ¥2,154 million (+5.8%), ordinary profit of ¥2,119 million (+4.7%) and profit attributable to owners of ¥1,390 million (+2.5%), or ¥167.09 per share.
Measured as a share of those targets, the first quarter looks light on profit: it delivered 25.1% of full-year revenue but 18.7% of operating profit and 17.6% of net profit, which leaves the remaining nine months to earn ¥1,752 million of operating profit on ¥23,592 million of revenue — a 7.4% margin against 5.1% in the quarter just reported. Measured by growth rate, it is close to plan: revenue grew 5.9% and operating profit 5.5% against guided full-year rates of 5.6% and 5.8%, and ordinary profit (+7.3%) and net profit (+3.0%) ran ahead of theirs. The filing does not discuss how profit is spread across the year.
The dividend forecast was also left unchanged: no interim dividend and a year-end dividend of ¥40.00 per share, against ¥39.00 for FY4/2026, an increase of 2.6% and about 24% of the guided ¥167.09 of earnings per share.
| Metric | Q1 FY4/2027 | Q1 FY4/2026 | Change |
|---|---|---|---|
| Revenue (¥ million) | 7,922 | 7,479 | +5.9% |
| Gross profit (¥ million) | 2,788 | 2,622 | +6.3% |
| Gross margin | 35.2% | 35.1% | +0.1 pt |
| SG&A expenses (¥ million) | 2,385 | 2,241 | +6.5% |
| Operating profit (¥ million) | 402 | 381 | +5.5% |
| Operating margin | 5.1% | 5.1% | unchanged |
| Ordinary profit (¥ million) | 413 | 385 | +7.3% |
| Net profit attrib. to owners of parent (¥ million) | 244 | 237 | +3.0% |
| EPS (¥) | 29.34 | 26.65 | +10.1% |
| Comprehensive income (¥ million) | 270 | 266 | +1.2% |
| Total assets (¥ million) | 29,437 | 29,052 | +1.3% |
| Net assets (¥ million) | 12,314 | 12,275 | +0.3% |
| Equity ratio | 41.6% | 42.1% | −0.5 pt |
| FY4/2027 guidance — revenue (¥ million) | 31,514 | — | +5.6% |
| FY4/2027 guidance — operating profit (¥ million) | 2,154 | — | +5.8% |
| FY4/2027 guidance — ordinary profit (¥ million) | 2,119 | — | +4.7% |
| FY4/2027 guidance — net profit (¥ million) | 1,390 | — | +2.5% |
| Annual dividend per share (¥) | 40.00 | 39.00 | +2.6% |
JapanStockPulse provides informational content only and does not constitute investment advice. Figures are taken from the company's published earnings short report and may be subject to subsequent revision.