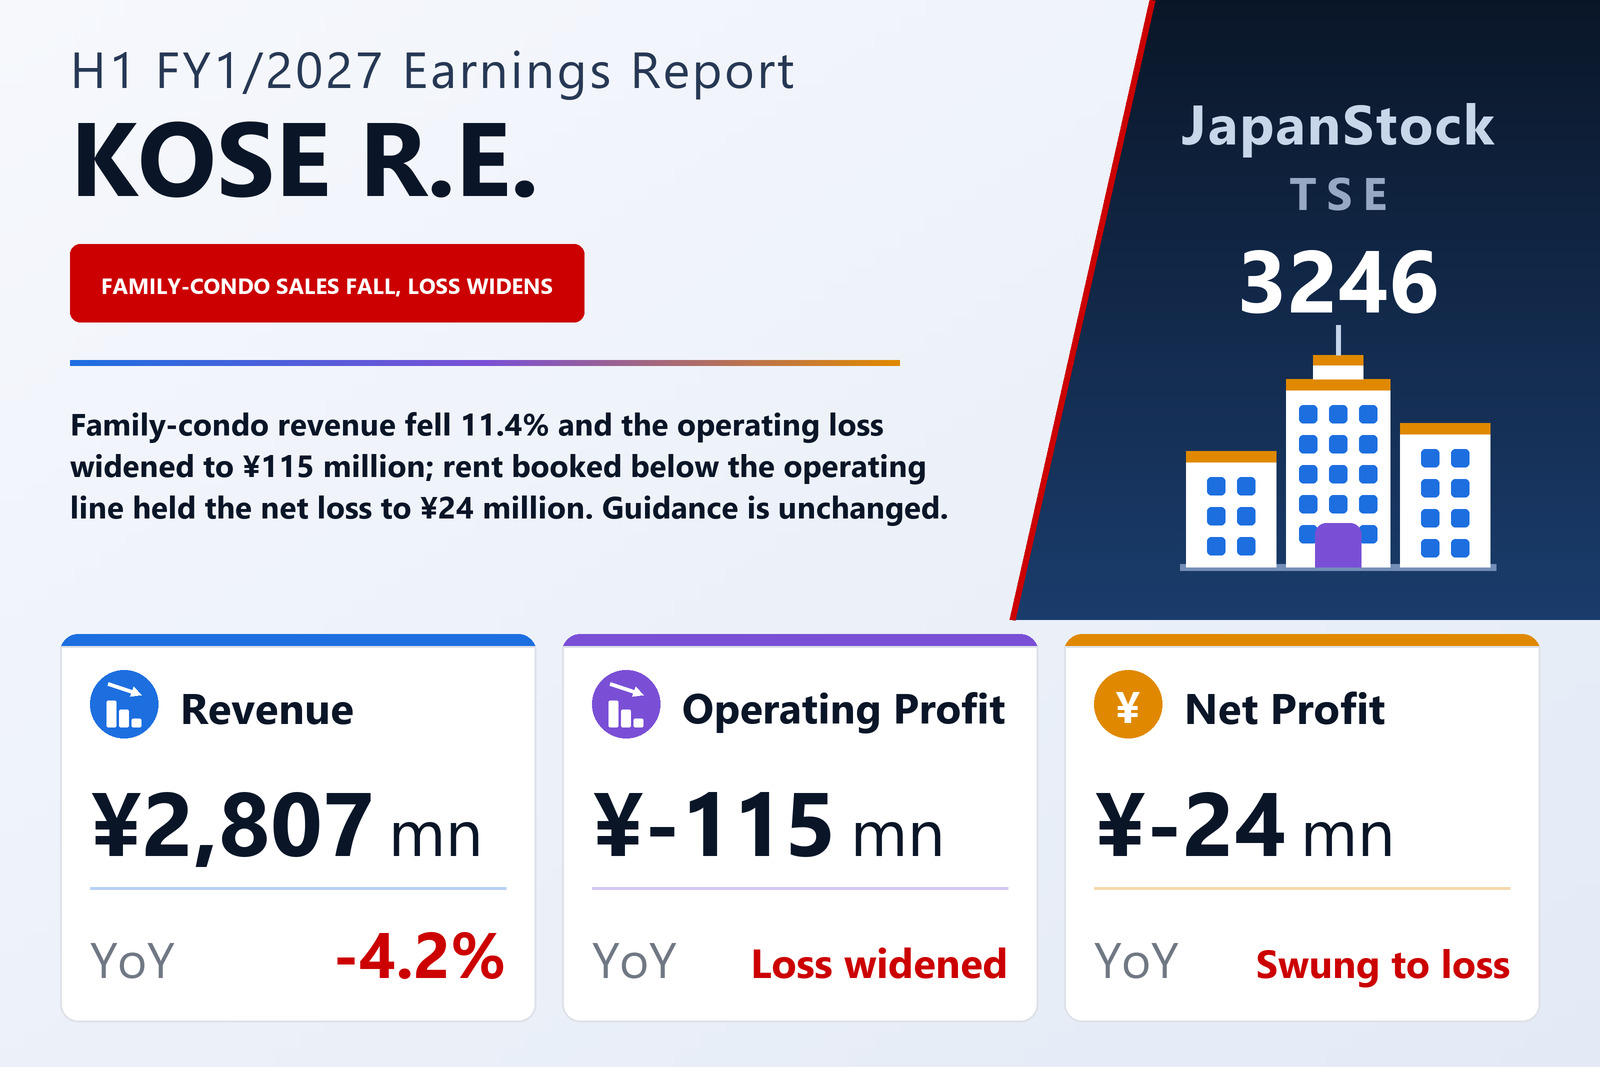
Revenue slipped 4.2% and the operating loss more than doubled
KOSE R.E. Co., Ltd. (TSE: 3246), a condominium developer and property manager whose current projects lie mainly in Fukuoka and Kagoshima prefectures, published consolidated first-half results for the six months from February 1 to July 31, 2026 on September 10, 2026, under Japanese GAAP. Revenue fell 4.2% to ¥2,807.0 million. The operating loss widened to ¥114.8 million from ¥52.4 million, an ordinary profit of ¥26.3 million turned into an ordinary loss of ¥23.8 million, and profit attributable to owners of the parent of ¥12.0 million became a loss of ¥24.1 million, or −¥2.37 per share against earnings of ¥1.18. The shares are listed on the Tokyo and Fukuoka stock exchanges; the interim statements were not reviewed by an auditor.
The path from revenue to the operating line is short. Cost of sales fell 3.3% to ¥2,146.6 million, less than revenue did, so gross profit fell 7.1% to ¥660.5 million and the gross margin narrowed from 24.3% to 23.5%. Selling, general and administrative expenses rose 1.5% to ¥775.3 million. Gross profit therefore lost ¥50.8 million while SG&A added ¥11.6 million, and those two moves account for the whole ¥62.4 million deterioration in the operating result; the operating margin went from −1.8% to −4.1%. By segment, the five businesses together earned ¥76.1 million against ¥124.6 million a year earlier, while unallocated corporate costs, mainly general and administrative expenses not attributed to any segment, rose 7.9% to ¥190.9 million.
Rent and interest sit below the operating line
Non-operating income rose 20.6% to ¥160.9 million, of which rent received was ¥117.0 million against ¥100.1 million and fees ¥19.6 million. Non-operating expenses rose 27.6% to ¥69.8 million, almost all of it interest: interest expense climbed 37.5% to ¥67.5 million, and the filing does not break the increase down. Net non-operating income of ¥91.0 million therefore covered most, but not all, of the operating loss, leaving an ordinary loss of ¥23.8 million. There were no extraordinary items. Income taxes came to only ¥0.3 million, because current taxes of ¥16.0 million were almost exactly offset by a ¥15.6 million deferred-tax credit, so the net loss attributable to owners of the parent was ¥24.1 million.
Family condominiums: one more unit, less revenue
The Family Condominium Sales segment delivered 42 units against 41, including stock carried over from the previous year, after completing one building in Kagoshima City. Revenue nonetheless fell 11.4% to ¥1,628.9 million and segment profit 52.1% to ¥33.7 million. One more unit on less revenue means lower revenue per unit, roughly ¥38.8 million against ¥44.8 million, though the filing gives no reason for the shift. During the half the segment launched sales at one building in Onojo, Fukuoka Prefecture, and kept selling one building each in Fukuoka City, Kasuga, Kurume, Kagoshima City, Shimonoseki in Yamaguchi Prefecture and Oyama in Tochigi Prefecture.
Investment Condominium Sales had no building completing in the half, so its 43 deliveries (37 a year earlier) all came from carried-over stock. Revenue rose 14.8% to ¥804.1 million and the segment loss narrowed to ¥9.9 million from ¥40.6 million.
The recurring businesses: a new warehouse's depreciation tips rental management into loss
Real Estate Rental Management revenue fell 17.6% to ¥147.9 million and the segment swung to a ¥3.6 million loss from a ¥49.4 million profit. Two new investment-condominium buildings were completed over the year, but property sales and the resulting changes of management company cut the units under management to 3,208 from 3,375. The filing attributes the loss to higher depreciation on a newly built warehouse completed at the end of the previous fiscal year; group depreciation in the cash-flow statement rose to ¥39.2 million from ¥15.4 million. Building Maintenance, which covers condominium management and maintenance and inspection work, grew revenue 5.8% to ¥192.5 million while segment profit fell 5.3% to ¥36.2 million. The brokerage business reported under Other grew revenue 11.0% to ¥33.7 million and profit 172.0% to ¥19.8 million.
Contracts: backlog down 8.4%, family-condo signings more than halved
The filing's contract table is the forward-looking part of the report. Contracts signed in the half totalled 154 units worth ¥4,043.5 million, 65.3% of the prior-year figure. Investment condominiums held steady at 102 units and ¥1,970.4 million (101.4% of the prior year), but family condominiums fell to 52 units and ¥2,073.1 million, 48.8% of the prior-year value, a starker picture than the narrative's statement that the segment built up contracts steadily. The backlog at July 31 was 158 units worth ¥4,759.2 million, 91.6% of a year earlier: ¥3,214.6 million in family condominiums (87.2%) and ¥1,544.6 million in investment condominiums (102.3%). The company describes a market in which rising land and construction costs keep pushing condominium prices up, while higher mortgage rates and household cost pressures make buyers more cautious.
Cash went into land and buildings under construction
Total assets fell 3.2% to ¥19,148.6 million from January 31, 2026. Real estate for sale in progress rose by ¥1,441.5 million to ¥10,081.9 million and completed real estate for sale by ¥586.1 million to ¥4,123.9 million, while cash and deposits fell by ¥2,619.3 million to ¥2,263.9 million, spent on condominium land, the dividend and the settlement of ¥861.4 million of electronically recorded obligations. Interest-bearing debt rose 7.2% to ¥7,776.4 million: long-term borrowings increased by ¥1,084.4 million, while short-term borrowings fell by ¥308.0 million and the current portion of long-term debt by ¥253.3 million. Net assets fell 2.5% to ¥10,392.3 million on the interim loss and the dividend, and because the balance sheet shrank faster, the equity ratio rose from 53.9% to 54.3%.
Operating cash flow was an outflow of ¥2,902.4 million against ¥2,198.8 million a year earlier, driven by a ¥2,027.5 million increase in inventories and a ¥690.9 million fall in payables; income taxes paid rose to ¥211.2 million from ¥79.8 million. Investing activities brought in ¥5.2 million and financing ¥273.7 million, as ¥1,220.0 million of new long-term borrowing more than covered ¥388.9 million of repayments, the ¥308.0 million reduction in short-term debt and ¥243.5 million of dividends. Cash and cash equivalents ended the half at ¥2,049.1 million, down ¥2,623.5 million.
Guidance held, and the second half has to carry the year
KOSE R.E. left unchanged the FY1/2027 guidance it published on March 12, 2026: revenue of ¥10,350 million (+3.0%), operating profit of ¥545 million (−29.1%), ordinary profit of ¥664 million (−32.4%) and profit attributable to owners of the parent of ¥440 million (−36.8%), or ¥43.32 per share. The first half delivered 27.1% of guided revenue and a loss at every profit line, so the guidance implies a second half of roughly ¥7,543 million in revenue and ¥660 million in operating profit. The July 31 backlog of ¥4,759.2 million equals about 63% of that implied second-half revenue; the filing does not say when the contracted units will be delivered, nor does it comment on how heavily the year is weighted to the second half.
The dividend forecast is also unchanged. As in the previous year no interim dividend is paid, and a year-end dividend of ¥24.00 is planned, matching the ¥24.00 paid for FY1/2026 and equal to about 55% of the guided ¥43.32 of earnings per share. On the average of 10,156,713 shares outstanding, that dividend comes to about ¥243.8 million, against guided net profit of ¥440 million.
| Metric | H1 FY1/2027 | H1 FY1/2026 | Change |
|---|---|---|---|
| Revenue (¥ million) | 2,807.0 | 2,930.8 | −4.2% |
| Gross profit (¥ million) | 660.5 | 711.3 | −7.1% |
| Gross margin | 23.5% | 24.3% | −0.8 pt |
| SG&A expenses (¥ million) | 775.3 | 763.6 | +1.5% |
| Operating profit (¥ million) | −114.8 | −52.4 | loss widened |
| Non-operating income (¥ million) | 160.9 | 133.4 | +20.6% |
| Interest expense (¥ million) | 67.5 | 49.1 | +37.5% |
| Ordinary profit (¥ million) | −23.8 | 26.3 | profit to loss |
| Net profit attrib. to owners of parent (¥ million) | −24.1 | 12.0 | profit to loss |
| EPS (¥) | −2.37 | 1.18 | profit to loss |
| Family Condominium Sales — revenue (¥ million) | 1,628.9 | 1,838.7 | −11.4% |
| Family Condominium Sales — segment profit (¥ million) | 33.7 | 70.3 | −52.1% |
| Investment Condominium Sales — revenue (¥ million) | 804.1 | 700.4 | +14.8% |
| Investment Condominium Sales — segment profit (¥ million) | −9.9 | −40.6 | loss narrowed |
| Real Estate Rental Management — revenue (¥ million) | 147.9 | 179.4 | −17.6% |
| Real Estate Rental Management — segment profit (¥ million) | −3.6 | 49.4 | profit to loss |
| Building Maintenance — revenue (¥ million) | 192.5 | 181.9 | +5.8% |
| Building Maintenance — segment profit (¥ million) | 36.2 | 38.2 | −5.3% |
| Other (brokerage) — revenue (¥ million) | 33.7 | 30.4 | +11.0% |
| Other (brokerage) — segment profit (¥ million) | 19.8 | 7.3 | +172.0% |
| Unallocated corporate expense (¥ million) | −190.9 | −177.0 | +7.9% |
| Condominium contracts signed in the period (¥ million) | 4,043.5 | — | −34.7% |
| Condominium contract backlog at period end (¥ million) | 4,759.2 | — | −8.4% |
| Total assets (¥ million) | 19,148.6 | 19,773.8 | −3.2% |
| Cash and deposits (¥ million) | 2,263.9 | 4,883.2 | −53.6% |
| Real estate for sale, incl. in progress (¥ million) | 14,205.7 | 12,178.1 | +16.6% |
| Interest-bearing debt (¥ million) | 7,776.4 | 7,253.2 | +7.2% |
| Net assets (¥ million) | 10,392.3 | 10,660.1 | −2.5% |
| Equity ratio | 54.3% | 53.9% | +0.4 pt |
| Operating cash flow (¥ million) | −2,902.4 | −2,198.8 | n.m. |
| FY1/2027 guidance — revenue (¥ million) | 10,350.0 | — | +3.0% |
| FY1/2027 guidance — operating profit (¥ million) | 545.0 | — | −29.1% |
| FY1/2027 guidance — ordinary profit (¥ million) | 664.0 | — | −32.4% |
| FY1/2027 guidance — net profit (¥ million) | 440.0 | — | −36.8% |
| FY1/2027 guidance — EPS (¥) | 43.32 | — | — |
| Annual dividend per share (¥) | 24.00 | 24.00 | unchanged |
JapanStockPulse provides informational content only and does not constitute investment advice. Figures are taken from the company's published earnings short report and may be subject to subsequent revision.