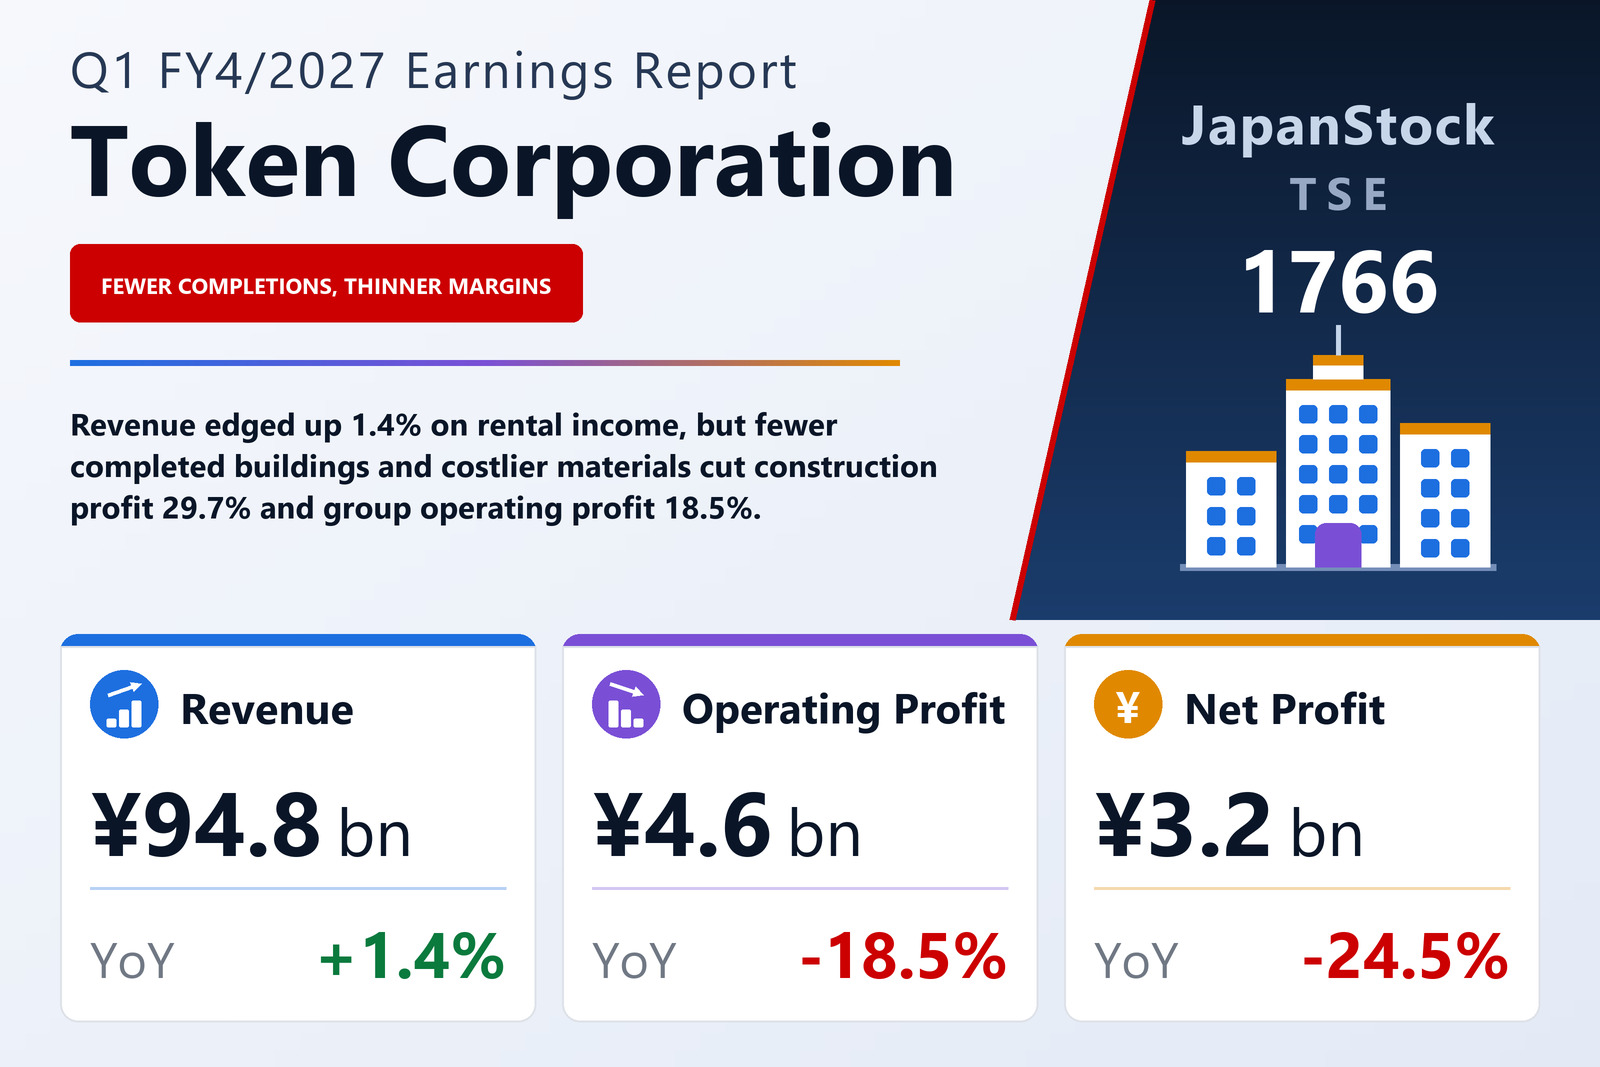
Revenue up 1.4%, operating profit down 18.5% — and the whole gap is in construction
Token Corporation (TSE: 1766), which builds rental apartment buildings for landowners and then leases and manages them under a master-lease system, published consolidated results for the first quarter of FY4/2027 — the three months from May 1 to July 31, 2026 — on September 11, 2026 under Japanese GAAP. Revenue rose 1.4% to ¥94,809 million, but operating profit fell 18.5% to ¥4,574 million, ordinary profit 17.5% to ¥4,749 million and profit attributable to owners of the parent 24.5% to ¥3,182 million, for earnings of ¥286.72 per share against ¥313.70. The company's shares are listed on the Tokyo and Nagoya stock exchanges.
The arithmetic is short. Cost of sales rose 2.6% to ¥79,403 million against revenue growth of 1.4%, so gross profit fell 4.0% to ¥15,406 million and the gross margin slipped 0.9 point, to 16.2% from 17.2%. Selling, general and administrative expenses grew 3.8% to ¥10,832 million — salaries and bonuses were almost flat at ¥5,855 million, but the "other" line rose 9.5% to ¥4,631 million — and with costs growing faster than revenue at both levels the operating margin fell from 6.0% to 4.8%. Of the ¥647 million decline in gross profit, every yen and more came from construction: gross profit on completed works fell ¥826 million to ¥10,901 million, while gross profit on the ancillary businesses, chiefly leasing, rose ¥180 million to ¥4,505 million.
Construction: plenty of work in hand, but few buildings reached completion
The construction segment's revenue fell 1.7% to ¥37,608 million and its segment profit 29.7% to ¥2,541 million, and the filing is specific about why. Orders grew in the previous fiscal year, so the backlog at the start of the year was ample and work proceeded broadly to schedule; revenue recognised over time on projects in progress increased, but few projects reached completion, so completed-works revenue came in below the prior-year quarter. On margin, rising prices for construction materials and housing equipment lowered the gross margin on completed works, which the income statement puts at 29.0% against 30.6% a year earlier. By product, on a parent-company basis, apartments — the bulk of the work at ¥29,428 million — slipped 0.8%, rental condominiums fell 9.8% to ¥4,167 million and store-and-residence buildings 16.4% to ¥1,720 million, for completed works of ¥35,696 million, down 2.4%.
What the quarter did not lack was demand. Parent-company orders received rose 18.1% to ¥59,267 million (consolidated orders were ¥60,917 million, up 17.8%, or ¥56,854 million net of cancellations, up 20.0%), and the parent-company order backlog stood at ¥290,703 million at July 31, 2026 — up 21.9% on a year earlier and 7.2% above the ¥271,083 million at April 30. The company also cites the housing market behind that: new housing starts in the period were about 190,000 units, up 18.7%, and new rental-housing starts about 85,000, up 21.2%, against a prior-year quarter that had been depressed by the reaction to the rush ahead of the amended Building Energy Efficiency Act. The backlog is work that will become completed-works revenue in later quarters; it did not become revenue in this one.
Leasing: 98.0% occupancy and now three fifths of revenue
The real-estate leasing segment — the master-lease business in which Token rents the buildings it has built from their owners and re-lets them, together with property management — grew revenue 3.6% to ¥56,618 million and segment profit 2.0% to ¥3,968 million despite higher expenses. The filing attributes the growth to a larger stock of managed properties, which lifted both the rent received from tenants under the master-lease system and management-fee income; occupancy across the rental buildings was 98.0% at quarter-end, which the company credits to its tenant-recruitment measures. The parent-company detail shows the same picture: brokerage fee income rose 8.1% to ¥1,009 million, move-out repair work 3.3% to ¥1,761 million and outsourced-services fee income 3.6% to ¥1,787 million, while renovation work fell 5.1% to ¥1,500 million. Leasing now provides 59.7% of group revenue and, at ¥3,968 million, about 61% of the ¥6,528 million of segment profit before corporate costs — which themselves rose 7.2% to ¥1,960 million.
The Other segment — an advertising agency, a travel agency and the operation of golf courses and hotel facilities — grew revenue 7.6% to ¥582 million and swung to a segment profit of ¥17 million from a loss of ¥57 million. Small as it is, that swing and the leasing segment's ¥79 million gain were the only profit improvements in the quarter.
Below the operating line: a one-off gone and a higher tax rate
Non-operating income rose to ¥205 million from ¥158 million — interest ¥28 million, insurance-agency income ¥70 million — and non-operating expenses to ¥30 million from ¥19 million, most of it claim-related damages, so ordinary profit fell 17.5% to ¥4,749 million, a fraction less than the operating line. Extraordinary gains, however, were just ¥1 million against ¥118 million, because the prior-year quarter had booked a ¥117 million gain on the reversal of an impairment account on leased assets that did not recur. Pre-tax profit therefore fell 19.1% to ¥4,750 million, and income taxes fell only 5.2% to ¥1,567 million, taking the effective tax rate to 33.0% from 28.2% — the deferred-tax adjustment rose to ¥542 million from ¥338 million. That is why net profit attributable to owners fell 24.5%, further than any line above it. Comprehensive income was ¥3,183 million against ¥4,220 million.
Earnings per share fell much less than profit — 8.6%, to ¥286.72 from ¥313.70 — because the average number of shares outstanding fell 17.4%, to 11,100,963 from 13,443,676. Treasury stock stood at 2,371,090 shares at July 31, 2026, barely changed from 2,371,020 at April 30, so the reduction was made during the previous fiscal year; it amounts to 17.6% of the 13,472,000 shares issued and is carried on the balance sheet at ¥29,794 million.
Cash down ¥7.6 billion, but the equity ratio rose to 55.5%
Total assets fell 3.4% to ¥208,234 million from ¥215,656 million at April 30, 2026, mainly because cash and deposits fell ¥7,611 million to ¥110,863 million; current assets were ¥129,816 million, down 4.9%. With a further ¥20,000 million in long-term deposits, cash and deposits together still make up about 63% of the balance sheet. Liabilities fell 6.7% to ¥92,697 million as construction payables dropped ¥2,047 million and income taxes payable ¥2,932 million, to ¥1,108 million, after the year-end tax payment; current liabilities were ¥65,737 million, down 9.0%, and long-term guarantee deposits received ¥21,647 million. Net assets slipped 0.7% to ¥115,537 million as retained earnings fell ¥813 million — consistent with the ¥360-per-share year-end dividend for FY4/2026 being paid out of a quarter that earned ¥3,182 million. Because liabilities fell faster than assets, the equity ratio rose to 55.5% from 54.0%. No cash-flow statement is prepared for the first quarter; depreciation was ¥515 million against ¥477 million.
Guidance and dividend unchanged — the plan needs a stronger second half
Token left the full-year forecast it published on June 12, 2026 unchanged: revenue of ¥408,218 million (+5.6%), operating profit of ¥20,175 million (−9.8%), ordinary profit of ¥21,108 million (−9.9%), net profit attributable to owners of ¥14,568 million (−9.9%) and earnings per share of ¥1,312.40. For the first half it expects revenue of ¥193,063 million (+3.2%), operating profit of ¥9,309 million (−14.2%) and net profit of ¥6,546 million (−17.4%). The first quarter delivered 49.1% of first-half revenue and 49.1% of first-half operating profit, which leaves an implied second quarter of about ¥4,735 million of operating profit — a touch above the ¥4,574 million just booked. Against the full year, the quarter delivered 23.2% of revenue, 22.7% of operating profit and 21.8% of net profit, so the plan implies operating profit of about ¥10,866 million in the second half against ¥9,309 million in the first; the filing does not say what drives the improvement.
The dividend forecast is also unchanged: ¥400.00 per share for FY4/2027, all of it at the year-end with no interim payment, against the ¥360.00 paid for FY4/2026 — an increase of 11.1%, and a payout of about 30% of the forecast ¥1,312.40 of earnings per share.
| Metric | Q1 FY4/2027 | Q1 FY4/2026 | Change |
|---|---|---|---|
| Revenue (¥ million) | 94,809 | 93,477 | +1.4% |
| Gross profit (¥ million) | 15,406 | 16,053 | −4.0% |
| Gross margin | 16.2% | 17.2% | −0.9 pt |
| SG&A expenses (¥ million) | 10,832 | 10,439 | +3.8% |
| Operating profit (¥ million) | 4,574 | 5,614 | −18.5% |
| Operating margin | 4.8% | 6.0% | −1.2 pt |
| Ordinary profit (¥ million) | 4,749 | 5,753 | −17.5% |
| Pre-tax profit (¥ million) | 4,750 | 5,871 | −19.1% |
| Net profit attrib. to owners of parent (¥ million) | 3,182 | 4,217 | −24.5% |
| EPS (¥) | 286.72 | 313.70 | −8.6% |
| Construction — revenue (¥ million) | 37,608 | 38,263 | −1.7% |
| Construction — segment profit (¥ million) | 2,541 | 3,614 | −29.7% |
| Real Estate Leasing — revenue (¥ million) | 56,618 | 54,672 | +3.6% |
| Real Estate Leasing — segment profit (¥ million) | 3,968 | 3,889 | +2.0% |
| Other — revenue (¥ million) | 582 | 541 | +7.6% |
| Other — segment profit (¥ million) | 17 | −57 | loss to profit |
| Orders received (¥ million) | 60,917 | 51,720 | +17.8% |
| Order backlog, parent only (¥ million) | 290,703 | 238,418 | +21.9% |
| Total assets (¥ million) | 208,234 | 215,656 | −3.4% |
| Cash and deposits (¥ million) | 110,863 | 118,474 | −6.4% |
| Net assets (¥ million) | 115,537 | 116,350 | −0.7% |
| Equity ratio | 55.5% | 54.0% | +1.5 pt |
| FY4/2027 guidance — revenue (¥ million) | 408,218 | — | +5.6% |
| FY4/2027 guidance — operating profit (¥ million) | 20,175 | — | −9.8% |
| FY4/2027 guidance — ordinary profit (¥ million) | 21,108 | — | −9.9% |
| FY4/2027 guidance — net profit (¥ million) | 14,568 | — | −9.9% |
| FY4/2027 guidance — EPS (¥) | 1,312.40 | — | — |
| Annual dividend per share (¥) | 400.00 | 360.00 | +11.1% |
JapanStockPulse provides informational content only and does not constitute investment advice. Figures are taken from the company's published earnings short report and may be subject to subsequent revision.