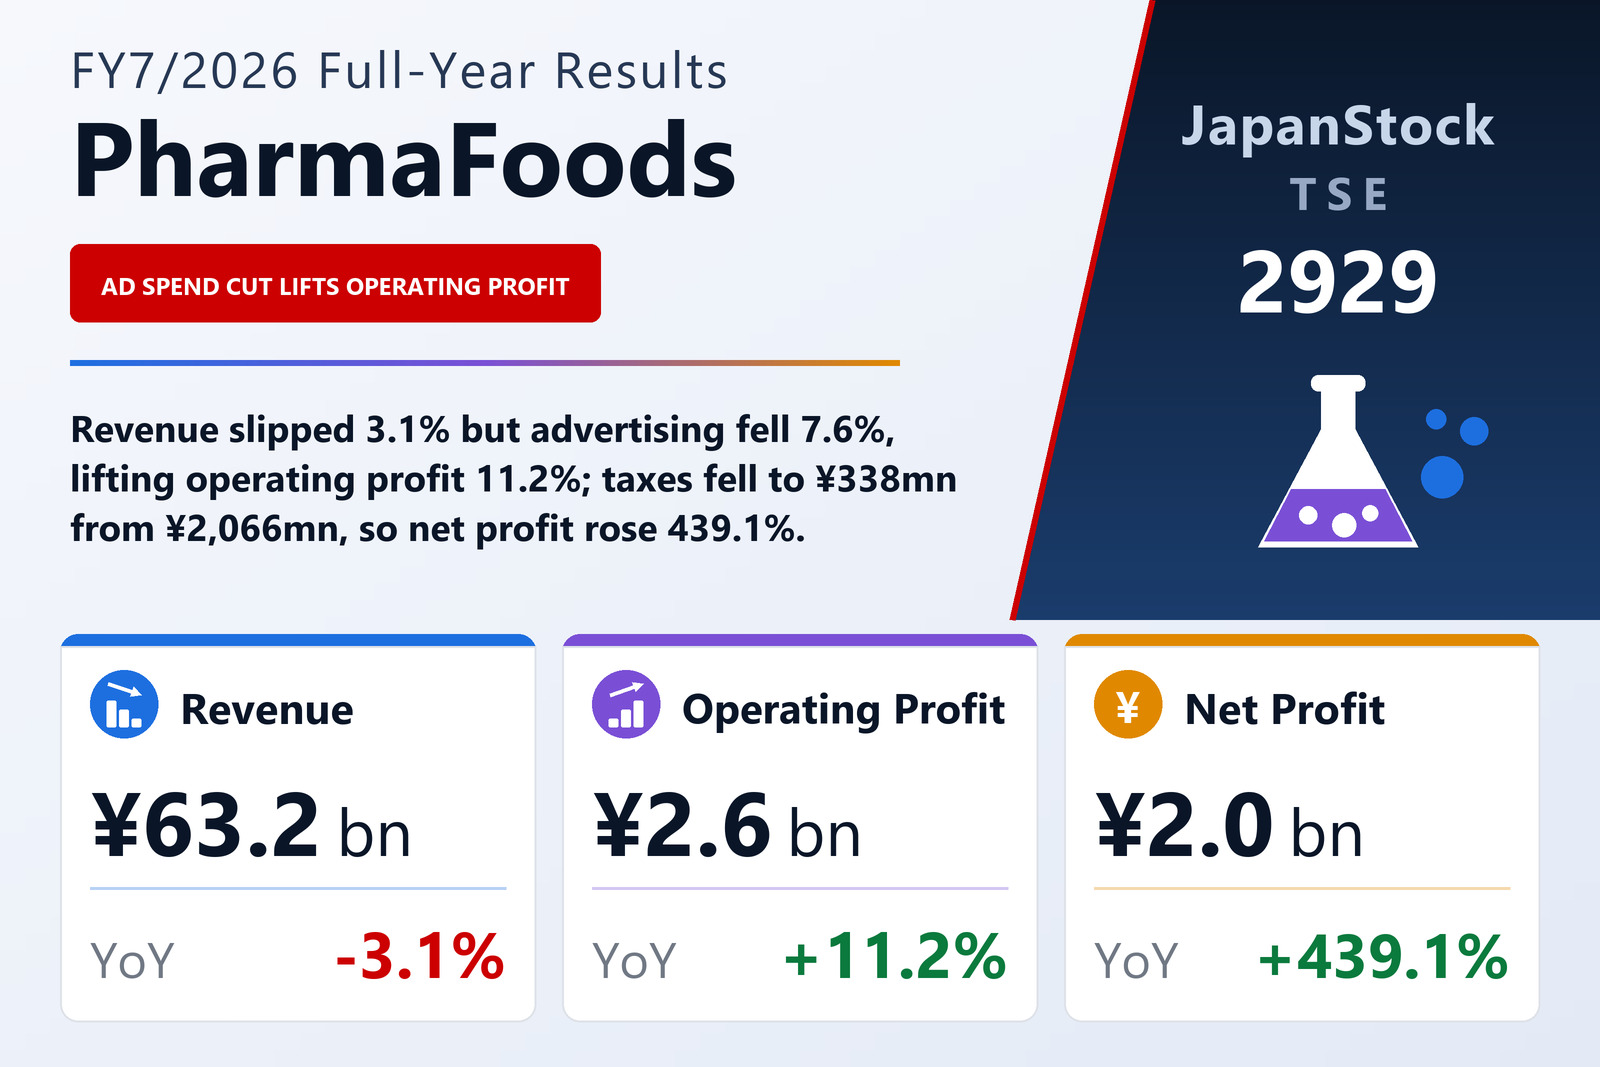
Operating profit up, ordinary profit down, net profit up more than fivefold
PharmaFoods International Co., Ltd. (TSE: 2929), a health-care group that develops its own functional ingredients and sells hair-growth products, over-the-counter medicines, supplements and cosmetics direct to consumers by mail order, published consolidated results for the fiscal year from August 1, 2025 to July 31, 2026 on September 11, 2026 under Japanese GAAP. Revenue fell 3.1% to ¥63,223 million, operating profit rose 11.2% to ¥2,632 million, ordinary profit fell 4.4% to ¥2,440 million and profit attributable to owners of the parent rose 439.1% to ¥1,988 million from ¥368 million, for earnings per share of ¥68.61 against ¥12.83. Return on equity rose to 16.1% from 3.1%. The shares are listed on the Tokyo Stock Exchange.
Revenue fell 3.1%, advertising fell 7.6% — and that gap is the operating result
Cost of sales barely moved, down 1.2% to ¥12,530 million, so gross profit fell 3.6% to ¥50,693 million and the gross margin eased from 80.6% to 80.2%. On a margin that high, the result is decided almost entirely in selling, general and administrative expenses, which fell 4.3% to ¥48,060 million. Advertising, much the largest item, fell 7.6% to ¥33,917 million — ¥2,775 million less — and dropped from 56.2% to 53.6% of revenue. Two lines went the other way: research and development rose 32.8% to ¥1,858 million and commission fees rose 10.5% to ¥4,896 million. Net of everything, SG&A came down ¥2,155 million while gross profit came down ¥1,890 million, and the ¥265 million difference is exactly the rise in operating profit, which took the operating margin from 3.6% to 4.2%.
The company presents the advertising cut as deliberate: it says it stepped up advertising behind new products while reviewing advertising on existing ones to improve profitability. The quarterly figures show how uneven the year was. Operating profit was a loss of ¥2,511 million in the first quarter, then ¥150 million and ¥930 million, and ¥4,063 million in the fourth — the most profitable quarter although its revenue of ¥14,688 million was the smallest of the four. The filing does not break advertising out by quarter, so it does not show how much of that swing came from the timing of spending.
Below the operating line, borrowing costs and an affiliate loss took the gain back
Ordinary profit fell 4.4% to ¥2,440 million despite the higher operating profit, because non-operating items turned against the company. Non-operating income fell to ¥373 million from ¥472 million: subsidy income was ¥208 million against ¥250 million, and the prior year's ¥109 million of compensation received did not recur. Non-operating expenses nearly doubled, to ¥565 million from ¥286 million, as interest expense rose to ¥161 million from ¥91 million, the loss on equity-method investments widened to ¥203 million from ¥131 million, and commission fees booked below the operating line rose to ¥155 million from ¥18 million. The filing does not explain that last item.
The 439% rise in net profit is a tax line, not a trading one
Extraordinary items were close to a wash in both years. This year brought a ¥4 million gain on the sale of fixed assets and a ¥117 million loss on the sale of shares in an affiliated company; the prior year carried a ¥118 million valuation loss on investment securities. Pre-tax profit therefore fell 4.4% to ¥2,327 million from ¥2,434 million, in step with ordinary profit. What changed was income taxes: ¥338 million against ¥2,066 million, made up of current taxes of ¥480 million against ¥2,256 million and a deferred-tax credit of ¥141 million against ¥190 million. That puts the tax charge at about 14.5% of pre-tax profit, against about 84.9% a year earlier, and it accounts for the whole of the move from ¥368 million to ¥1,988 million of net profit.
The consolidated discussion gives no reason for the lower tax charge. The non-consolidated summary in the same filing does show the parent company's own profit collapsing: its operating profit fell to ¥153 million from ¥7,004 million and its ordinary profit to ¥311 million from ¥7,213 million, and it recorded a net loss of ¥237 million against a profit of ¥2,732 million, on revenue down 3.2% to ¥40,867 million. The filing neither explains that shift nor links it to the tax line. Comprehensive income was ¥2,160 million against minus ¥3 million, helped by a ¥171 million gain on the valuation of securities after a ¥372 million loss the year before.
BtoC profit up 21% on lower advertising; BtoB and Biomedical weaker
The BtoC Business, which sells supplements and quasi-drugs built on the company's own ingredients, medicines made by subsidiary Meiji Yakuhin, and cosmetics by mail order and in stores, accounted for 87.6% of revenue. Its revenue fell 2.4% to ¥55,368 million, but its advertising fell 7.4% to ¥33,810 million and segment profit rose 21.0% to ¥4,481 million. Medicines and quasi-drugs, led by the Nyumo hair-growth brand, were almost flat at ¥43,192 million (−0.2%); supplements fell 8.4% to ¥5,983 million and cosmetics 11.3% to ¥5,542 million. The company says medicines for knee joints, gut health, tinnitus and night-time urination sold well.
BtoB Business revenue fell 8.7% to ¥7,471 million and segment profit 10.9% to ¥1,112 million. Functional ingredients, its largest line, fell 17.3% to ¥2,585 million; the filing says timing slippages in a changing market left sales below expectations, although sales of its PharmaGABA ingredient in North America came to 103% of the prior-year level and in Thailand to 151%, with 25 new adoptions. Contract drug manufacturing at Meiji Yakuhin fell 16.8% to ¥2,677 million, while functional products rose 20.3% to ¥894 million and drugstore-channel sales rose 20.4% to ¥1,313 million, a line in which the filing says sales of the quasi-drug Lactron tablets rose 112%. The Biomedical Business — antibody drug discovery based on the company's chicken-derived antibody technology, plus contract proteome analysis — lifted revenue 5.9% to ¥350 million, but its loss widened to ¥838 million from ¥378 million. Corporate costs not allocated to segments were ¥2,109 million against ¥2,195 million.
Construction in progress jumped, and borrowing paid for it
Total assets rose 7.6% to ¥35,115 million. Property, plant and equipment grew by ¥3,322 million to ¥8,018 million, driven by construction in progress, which rose to ¥3,671 million from ¥164 million; the filing does not say what is being built, although its contract-manufacturing section says Meiji Yakuhin is stepping up sales to drug makers with a new plant in view. Merchandise and finished goods rose ¥1,222 million to ¥7,533 million, while cash and deposits fell to ¥7,791 million from ¥9,157 million. Borrowings rose to ¥17,171 million from ¥12,631 million — ¥13,400 million short-term, ¥3,211 million long-term and ¥560 million due within a year — while other payables fell to ¥1,292 million from ¥3,520 million and income taxes payable to ¥418 million from ¥1,494 million. Net assets rose 14.0% to ¥13,166 million and the equity ratio to 37.5% from 35.4%.
Operating cash flow was negative for a second year, at minus ¥1,175 million against minus ¥1,092 million. Pre-tax profit of ¥2,327 million and a ¥1,294 million fall in receivables were outweighed by ¥2,528 million of income taxes paid, a ¥2,228 million fall in other payables and a ¥1,293 million build in inventories. Investing activities used ¥4,000 million, including ¥4,014 million spent on property, plant and equipment. Financing brought in ¥3,808 million — ¥2,000 million of net short-term borrowing and ¥3,100 million of new long-term loans, less ¥560 million of repayments and ¥723 million of dividends — and cash and cash equivalents ended the year 15.1% lower at ¥7,691 million.
Guidance: flat revenue, higher profit, and the dividend held at ¥25
For FY7/2027 the company forecasts revenue of ¥64,000 million (+1.2%), operating profit of ¥3,000 million (+14.0%), ordinary profit of ¥3,400 million (+39.3%) and profit attributable to owners of the parent of ¥2,200 million (+10.7%), or ¥75.75 per share; it publishes full-year guidance only. The forecast puts ordinary profit ¥400 million above operating profit, where this year it came in ¥192 million below, and the filing does not explain that assumed turn in non-operating items. Its stated direction is to stop pursuing revenue growth for its own sake and to run the business for profitability and capital efficiency, concentrating resources on priority areas.
The dividend was held at ¥25.00 per share — ¥12.50 at the interim and ¥12.50 at the year-end — for a total of ¥726 million. Because net profit rose so sharply, the payout ratio fell to 36.4% from 194.8%. Payment of the year-end dividend is scheduled to begin on October 30, 2026, and the company forecasts another ¥25.00 for FY7/2027, a payout ratio of 33.0%.
| Metric | FY7/2026 | FY7/2025 | Change |
|---|---|---|---|
| Revenue (¥ million) | 63,223 | 65,260 | −3.1% |
| Cost of sales (¥ million) | 12,530 | 12,676 | −1.2% |
| Gross profit (¥ million) | 50,693 | 52,583 | −3.6% |
| Gross margin | 80.2% | 80.6% | −0.4 pt |
| SG&A expenses (¥ million) | 48,060 | 50,215 | −4.3% |
| — of which advertising expenses (¥ million) | 33,917 | 36,692 | −7.6% |
| — of which R&D expenses (¥ million) | 1,858 | 1,399 | +32.8% |
| Operating profit (¥ million) | 2,632 | 2,367 | +11.2% |
| Operating margin | 4.2% | 3.6% | +0.6 pt |
| Ordinary profit (¥ million) | 2,440 | 2,553 | −4.4% |
| Pre-tax profit (¥ million) | 2,327 | 2,434 | −4.4% |
| Income taxes (¥ million) | 338 | 2,066 | −83.6% |
| Net profit attrib. to owners of parent (¥ million) | 1,988 | 368 | +439.1% |
| EPS (¥) | 68.61 | 12.83 | +434.8% |
| Comprehensive income (¥ million) | 2,160 | −3 | loss to profit |
| Return on equity | 16.1% | 3.1% | +13.0 pt |
| BtoC Business — revenue (¥ million) | 55,368 | 56,730 | −2.4% |
| BtoC Business — segment profit (¥ million) | 4,481 | 3,703 | +21.0% |
| BtoC Business — medicines & quasi-drugs (¥ million) | 43,192 | 43,266 | −0.2% |
| BtoC Business — supplements (¥ million) | 5,983 | 6,532 | −8.4% |
| BtoC Business — cosmetics (¥ million) | 5,542 | 6,248 | −11.3% |
| BtoB Business — revenue (¥ million) | 7,471 | 8,182 | −8.7% |
| BtoB Business — segment profit (¥ million) | 1,112 | 1,248 | −10.9% |
| Biomedical Business — revenue (¥ million) | 350 | 331 | +5.9% |
| Biomedical Business — segment profit (¥ million) | −838 | −378 | loss widened |
| Total assets (¥ million) | 35,115 | 32,649 | +7.6% |
| Net assets (¥ million) | 13,166 | 11,547 | +14.0% |
| Equity ratio | 37.5% | 35.4% | +2.1 pt |
| Total borrowings (¥ million) | 17,171 | 12,631 | +35.9% |
| Operating cash flow (¥ million) | −1,175 | −1,092 | n.m. |
| Investing cash flow (¥ million) | −4,000 | −950 | n.m. |
| Financing cash flow (¥ million) | 3,808 | −4,467 | n.m. |
| Cash and cash equivalents at year-end (¥ million) | 7,691 | 9,057 | −15.1% |
| FY7/2027 guidance — revenue (¥ million) | 64,000 | — | +1.2% |
| FY7/2027 guidance — operating profit (¥ million) | 3,000 | — | +14.0% |
| FY7/2027 guidance — ordinary profit (¥ million) | 3,400 | — | +39.3% |
| FY7/2027 guidance — net profit (¥ million) | 2,200 | — | +10.7% |
| FY7/2027 guidance — EPS (¥) | 75.75 | — | +10.4% |
| Annual dividend per share (¥) | 25.00 | 25.00 | unchanged |
| Dividend payout ratio | 36.4% | 194.8% | −158.4 pt |
JapanStockPulse provides informational content only and does not constitute investment advice. Figures are taken from the company's published earnings short report and may be subject to subsequent revision.