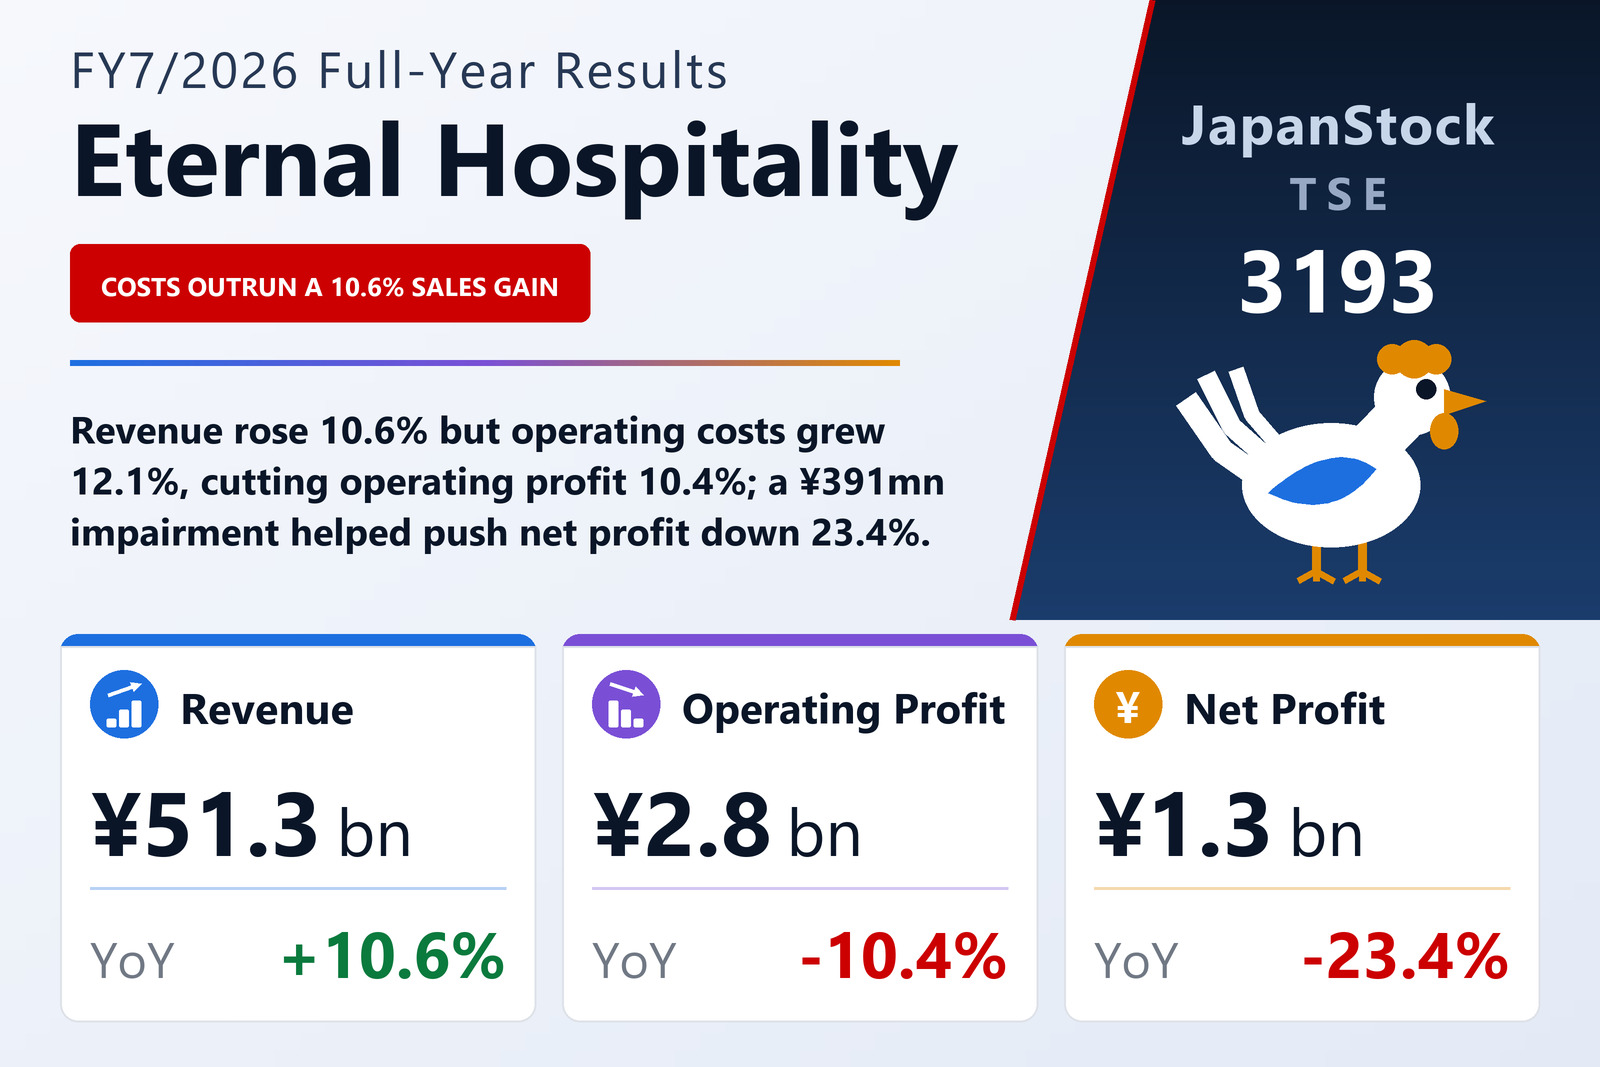
Revenue up 10.6%, operating profit down 10.4%: costs grew faster than sales
Eternal Hospitality Group Co., Ltd. (TSE: 3193), the operator of the Torikizoku yakitori restaurant chain, published consolidated results for the full year FY7/2026, the twelve months from August 1, 2025 to July 31, 2026, on September 11, 2026 under Japanese GAAP. Revenue rose 10.6% to ¥51,254 million, but operating profit fell 10.4% to ¥2,797 million, ordinary profit 9.8% to ¥2,800 million and profit attributable to owners of the parent 23.4% to ¥1,318 million. Earnings per share came to ¥57.13 against ¥74.61; both figures are calculated as if the 2-for-1 stock split that took effect on August 1, 2026 had been in place from the start of the prior year. The filing names the Tokyo Stock Exchange as the listing exchange.
The year was shaped by three growth rates. Cost of sales rose 12.3% to ¥16,373 million, faster than revenue, so gross profit grew only 9.8% to ¥34,881 million and the gross margin slipped from 68.5% to 68.1%. Selling, general and administrative expenses, by far the larger cost line, rose 12.0% to ¥32,083 million, lifting their share of revenue from 61.8% to 62.6%. With both cost lines outgrowing sales, operating profit fell by ¥324 million and the operating margin narrowed from 6.7% to 5.5%. The filing does not break the cost increase down by item. Its description of the operating environment names intermittent rises in raw-material prices, higher energy and labour costs and rising store fit-out and construction costs, while saying that demand for eating out stayed firm on the back of sustained wage increases.
Torikizoku's existing stores drew more customers at a higher spend
Demand itself was not the problem. At directly operated Torikizoku stores in Japan that were open in both years, customer numbers rose 3.8% and spending per customer 2.8%, taking existing-store sales up 6.7%. The company attributes that to its measures and its pricing: a year-long 40th-anniversary campaign that brought back past signature menu items as two-month limited offers, a first Torikizoku lucky-bag sale in November 2025 and a series of promotions and tie-up products in May and June 2026, together with a price revision in May 2025 after which, it says, customer usage showed no significant change.
Revenue from directly operated stores rose 8.7% to ¥18,587 million in western Japan and 9.2% to ¥29,552 million in eastern Japan, while overseas directly operated revenue more than doubled, to ¥1,238 million from ¥597 million; other revenue from contracts with customers rose 19.4% to ¥1,751 million. The regional split is new this year, and the prior year has been restated onto it. At year end the Torikizoku brand had 695 stores in Japan, a net increase of 34, of which 424 were directly operated (a net increase of 16). With the 463 Yakitori Daikichi stores run by Daikichi System and five others, the group had 1,163 stores in Japan, 426 of them directly operated, plus 31 overseas (25 Torikizoku, three Yakitori Daikichi and three others), with operations in the United States, Shanghai, South Korea, Taiwan, Hong Kong, Vietnam and Singapore. The group reports a single restaurant segment and publishes no segment figures.
The year also brought a new structure for the Japanese business. Through company splits on August 1, 2025, Eternal Hospitality Japan Co., Ltd., newly consolidated this year, became the regional holding company for Japan, with separate operating companies for eastern and western Japan beneath it; the former Torikizoku Co., Ltd. and TORIKI BURGER Co., Ltd. were renamed accordingly. The transactions were accounted for as under common control. Three newly established companies, including TORIKIZOKU FRANCHISE INC., were also consolidated. Alongside Torikizoku, the group runs brands by price tier, including the luxury mozu in South Korea and Taimatsu in Japan and the premium zoku in the United States and Yakitori no Hachibei in Japan.
Below the operating line, impairments and a higher tax rate deepen the fall
Non-operating items were close to a wash: income of ¥109 million, including a foreign-exchange gain of ¥52 million, against expenses of ¥106 million that included interest of ¥38 million and a new ¥24 million provision for doubtful accounts. Ordinary profit therefore fell a little less than operating profit, by 9.8% to ¥2,800 million. Extraordinary items did more damage. Impairment losses rose to ¥391 million from ¥48 million and total extraordinary losses to ¥429 million from ¥74 million, partly offset by ¥127 million of relocation compensation booked as extraordinary income; the filing does not say which stores were impaired or what the compensation related to. Pre-tax profit fell 17.5% to ¥2,497 million. Income taxes fell by less, 9.8% to ¥1,179 million, lifting the effective rate from 43.2% to 47.2%, and profit attributable to owners of the parent ended 23.4% lower at ¥1,318 million. Comprehensive income fell a smaller 13.1%, to ¥1,382 million, because foreign-currency translation adjustments turned positive.
The stock split restates per-share data, and the dividend holds
Eternal Hospitality Group split each common share into two with effect from August 1, 2026, with July 31, 2026 as the record date, taking issued shares to 23,244,600. Earnings per share (¥57.13 against ¥74.61) and net assets per share (¥460.65 against ¥423.72) are stated on the post-split basis for both years. Dividends are not: the FY7/2026 annual dividend of ¥46.00, made up of ¥23.00 at the half and ¥23.00 at year end, is the actual pre-split amount and unchanged from FY7/2025. Because the split took effect after the record date, the year-end dividend is paid on pre-split shares, with payment scheduled to begin on October 29, 2026. Total dividends were ¥534 million in both years, and with lower earnings the payout ratio rose from 30.8% to 40.3%. For FY7/2027 the company forecasts ¥23.00 per share on the post-split basis, ¥11.50 at the half and ¥11.50 at year end, which matches ¥46.00 before the split, for a forecast payout ratio of 28.1%.
Operating cash flow rose 62.5% and borrowings fell by more than a third
Cash generation improved even as profit fell. Operating cash flow rose 62.5% to ¥4,050 million: pre-tax profit of ¥2,497 million was supplemented by depreciation of ¥1,427 million, up 19.5%, and the non-cash impairment of ¥391 million, while income taxes paid fell to ¥828 million from ¥1,512 million. Investing outflows were ¥2,491 million, mainly ¥2,033 million spent on property and equipment, leaving free cash flow of about ¥1,559 million. Financing outflows widened to ¥1,919 million from ¥689 million, chiefly long-term loan repayments of ¥1,223 million, with no new long-term borrowing against ¥1,000 million a year earlier, and dividends of ¥534 million. Cash and equivalents ended the year at ¥7,167 million, down 4.2%.
Total assets rose 7.6% to ¥23,003 million, mainly because new stores added buildings, and net assets 8.7% to ¥10,628 million as retained earnings grew, lifting the equity ratio from 45.7% to 46.2%. Long-term borrowings, including the current portion, fell to ¥2,067 million from ¥3,290 million. Current liabilities rose by ¥1,340 million to ¥9,182 million, mainly on higher accrued consumption taxes (¥1,194 million against ¥398 million) and income taxes payable (¥871 million against ¥406 million).
FY7/2027 guidance calls for profit to rise, after a weaker first half
For FY7/2027 the company forecasts revenue of ¥57,231 million (+11.7%), operating profit of ¥3,078 million (+10.0%), ordinary profit of ¥3,050 million (+9.0%) and profit attributable to owners of the parent of ¥1,891 million (+43.5%), or ¥81.98 per share on the post-split basis. The net-profit growth rate is measured against a year in which net profit absorbed a ¥391 million impairment and a 47.2% effective tax rate; the filing does not provide a bridge between the two years. The first-half forecast is weaker than the full year: revenue up 10.2% to ¥27,990 million, but operating profit down 5.2% to ¥1,532 million and net profit down 11.3% to ¥936 million, so the guided recovery rests on the second half.
The company expects consumer spending in Japan to stay broadly firm on improving employment and incomes, but raw-material, energy and labour costs to keep rising and store fit-out and construction costs to stay high. In Japan it plans to strengthen the Torikizoku brand's products, service and brand value and to make store opening and operation more efficient; overseas, it says each country and region differs in market characteristics, customer needs and brand acceptance, and it intends to tailor openings and formats to each market's stage and to establish a business model suited to each.
| Metric | FY7/2026 | FY7/2025 | Change |
|---|---|---|---|
| Revenue (¥ million) | 51,254 | 46,356 | +10.6% |
| Cost of sales (¥ million) | 16,373 | 14,581 | +12.3% |
| Gross profit (¥ million) | 34,881 | 31,774 | +9.8% |
| Gross margin | 68.1% | 68.5% | −0.5 pt |
| SG&A expenses (¥ million) | 32,083 | 28,653 | +12.0% |
| Operating profit (¥ million) | 2,797 | 3,121 | −10.4% |
| Operating margin | 5.5% | 6.7% | −1.3 pt |
| Ordinary profit (¥ million) | 2,800 | 3,103 | −9.8% |
| Relocation compensation (extraordinary income) (¥ million) | 127 | — | new |
| Impairment losses (¥ million) | 391 | 48 | +706.7% |
| Extraordinary losses (¥ million) | 429 | 74 | +480.0% |
| Pre-tax profit (¥ million) | 2,497 | 3,029 | −17.5% |
| Income taxes (¥ million) | 1,179 | 1,308 | −9.8% |
| Net profit attrib. to owners of parent (¥ million) | 1,318 | 1,720 | −23.4% |
| EPS, restated for the 2-for-1 split (¥) | 57.13 | 74.61 | −23.4% |
| Comprehensive income (¥ million) | 1,382 | 1,591 | −13.1% |
| Revenue — directly operated stores, western Japan (¥ million) | 18,587 | 17,103 | +8.7% |
| Revenue — directly operated stores, eastern Japan (¥ million) | 29,552 | 27,070 | +9.2% |
| Revenue — directly operated stores, overseas (¥ million) | 1,238 | 597 | +107.4% |
| Revenue — other (¥ million) | 1,751 | 1,466 | +19.4% |
| Group stores in Japan at year end | 1,163 | — | — |
| Group stores overseas at year end | 31 | — | — |
| Total assets (¥ million) | 23,003 | 21,382 | +7.6% |
| Net assets (¥ million) | 10,628 | 9,774 | +8.7% |
| Equity ratio | 46.2% | 45.7% | +0.5 pt |
| Long-term borrowings incl. current portion (¥ million) | 2,067 | 3,290 | −37.2% |
| Operating cash flow (¥ million) | 4,050 | 2,492 | +62.5% |
| Investing cash flow (¥ million) | −2,491 | −2,694 | n.m. |
| Financing cash flow (¥ million) | −1,919 | −689 | n.m. |
| Cash and equivalents at year end (¥ million) | 7,167 | 7,485 | −4.2% |
| FY7/2027 guidance — revenue (¥ million) | 57,231 | — | +11.7% |
| FY7/2027 guidance — operating profit (¥ million) | 3,078 | — | +10.0% |
| FY7/2027 guidance — ordinary profit (¥ million) | 3,050 | — | +9.0% |
| FY7/2027 guidance — net profit attrib. to owners of parent (¥ million) | 1,891 | — | +43.5% |
| FY7/2027 guidance — EPS, post-split (¥) | 81.98 | — | +43.5% |
| Annual dividend per share, both years before the split (¥) | 46.00 | 46.00 | unchanged |
| FY7/2027 forecast annual dividend per share, post-split (¥) | 23.00 | — | — |
JapanStockPulse provides informational content only and does not constitute investment advice. Figures are taken from the company's published earnings short report and may be subject to subsequent revision.