Revenue up 60.2%, both cost lines slower — and the operating margin widened a point
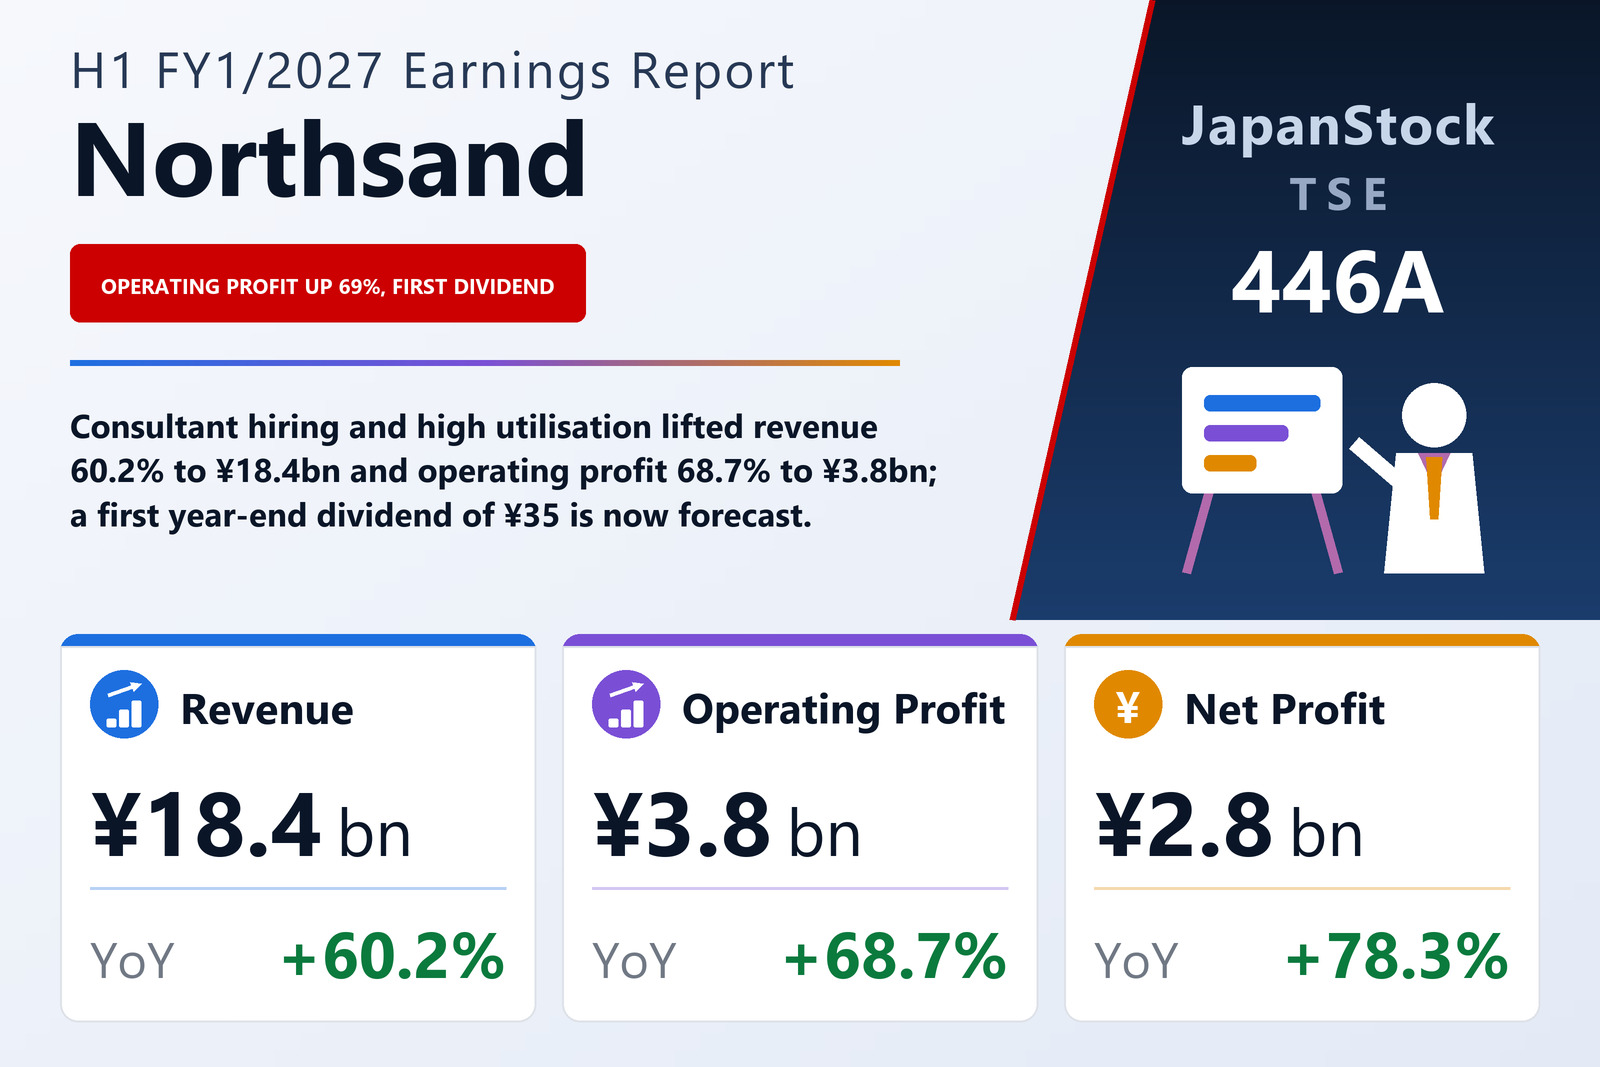
Northsand, Inc. (TSE: 446A), a consultancy that reports a single consulting segment and whose management ties demand to corporate business-reform programmes, including the use of generative AI, published non-consolidated first-half results for the six months from February 1 to July 31, 2026 on September 11, 2026 under Japanese GAAP. Revenue rose 60.2% to ¥18,445 million, operating profit 68.7% to ¥3,766 million, ordinary profit 68.8% to ¥3,773 million and interim net profit 78.3% to ¥2,783 million, for earnings of ¥40.33 per share against ¥26.01. The filing lists the company as listed on the Tokyo Stock Exchange; it names no market segment.
The arithmetic is simple and worth setting out. Cost of sales rose 60.1% to ¥9,536 million, almost exactly in step with revenue, so gross profit grew 60.3% to ¥8,909 million and the gross margin stayed at 48.3% in both periods. The whole of the operating improvement therefore came from overheads: selling, general and administrative expenses rose 54.7% to ¥5,143 million, five and a half points slower than sales, and the operating margin moved from 19.4% to 20.4%. The company gives two reasons for the growth, and only two — recruitment of new consultants progressed smoothly, and it continued to maintain a high utilisation rate. It publishes neither a headcount nor a utilisation figure in the filing.
Below the operating line there is little to explain — except a lower tax rate
Non-operating income was ¥15 million against ¥14 million, with interest income up to ¥10 million from ¥1 million and a prior-year foreign-exchange gain of ¥6 million replaced by a loss of ¥2 million booked under expenses; non-operating expenses fell to ¥8 million from ¥11 million. Ordinary profit was therefore ¥3,773 million, up 68.8%, all but identical to the operating line. The only extraordinary item was a ¥2 million loss on the retirement of fixed assets, leaving pre-tax interim profit of ¥3,771 million, up 68.6%. Income taxes rose only 46.4% to ¥988 million, an effective rate of about 26.2% against 30.2% a year earlier — the filing notes that interim tax is computed by applying an estimated annual effective rate to pre-tax profit — and that lower rate is why net profit grew 78.3%, ten points faster than pre-tax profit.
Earnings per share were ¥40.33 against ¥26.01, both restated for the 60-for-1 stock split of September 8, 2025, and diluted earnings per share were ¥38.77. No diluted figure is shown for the prior-year interim because, as the filing explains, the company's shares were not listed at the time and no average share price existed. Earnings per share grew 55.1%, well short of the 78.3% growth in net profit: ¥2,783 million over the 69,000,000 shares reported as the current average gives the ¥40.33 printed, whereas the filing's share table also prints 69,000,000 as the prior-year interim average, which would yield about ¥22.61 rather than the ¥26.01 shown. The filing offers no reconciliation, and this article reports the per-share figures as printed.
One segment, and the filing's account of why demand held up
Northsand reports a single consulting segment, so there is no segment breakdown. The company's own account of the environment is that the Japanese economy is in a moderate recovery supported by corporate earnings and employment and income conditions, while trade policy under the US administration, the situation in the Middle East and currency movements keep the outlook uncertain. Against that, it says a growing number of companies are undertaking business-reform programmes — including the use of generative AI and other advanced technologies — to strengthen competitiveness and pursue growth strategies, and it expects demand for consulting to remain firm on that basis. That is the entire stated causal chain: firm demand, more consultants hired, and utilisation kept high.
Cash moved into deposits and guarantees, and the equity ratio still rose
Total assets rose 11.5% to ¥24,376 million from ¥21,861 million at January 31, 2026. Current assets grew by ¥699 million to ¥19,297 million, mainly on an ¥832 million rise in accounts receivable to ¥3,999 million, partly offset by a ¥207 million fall in cash and deposits to ¥14,394 million. Non-current assets grew by ¥1,815 million to ¥5,078 million, almost entirely on a ¥1,744 million increase in deposits and guarantees to ¥4,013 million; the filing states the amount but not its purpose. Property, plant and equipment rose to ¥829 million from ¥654 million, with ¥198 million spent on purchases in the half.
Current liabilities fell by ¥213 million to ¥4,522 million, which the filing attributes to a ¥260 million decrease in accrued consumption taxes and a ¥154 million decrease in accrued income taxes, partly offset by a ¥146 million rise in accounts payable and accrued expenses. Non-current liabilities fell by ¥55 million to ¥615 million as long-term borrowings were repaid down to ¥254 million and lease obligations rose to ¥139 million. Net assets rose 16.9% to ¥19,238 million, and the entire increase of ¥2,783 million is retained earnings — share capital of ¥4,717 million and capital surplus of ¥4,734 million were unchanged, and issued shares stayed at 69,000,000 with no treasury stock. With liabilities lower and equity higher, the equity ratio rose from 75.3% to 78.9%.
Operating cash flow of ¥1,913 million, and ¥2,974 million out through investing
Net cash from operating activities was ¥1,913 million against ¥1,156 million, driven by pre-tax profit of ¥3,771 million and reduced mainly by income taxes paid of ¥1,061 million and the ¥832 million increase in trade receivables. Investing activities absorbed ¥2,974 million against ¥15 million: ¥1,776 million was paid out as deposits and guarantees and ¥1,005 million was placed in time deposits, with ¥198 million of property purchases. Financing activities used ¥146 million, chiefly ¥121 million of long-term loan repayments and ¥10 million of bond redemptions, and no new borrowing was taken — a year earlier the company had drawn and repaid short-term loans. Cash and cash equivalents ended the half at ¥13,389 million, down ¥1,207 million from ¥14,597 million; the ¥1,005 million gap to the balance-sheet figure for cash and deposits is the time deposits placed during the period.
Guidance revised and a first dividend of ¥35 — but the previous forecast is not in this filing
Northsand now forecasts full-year FY1/2027 revenue of ¥40,560 million (+54.9%), operating profit of ¥9,207 million (+66.0%), ordinary profit of ¥9,221 million (+68.3%) and net profit of ¥6,823 million (+68.6%), for earnings per share of ¥98.89. The filing marks both the earnings forecast and the dividend forecast as revised from the figures published on March 13, 2026 and refers readers to a separate notice released the same day; it prints neither the previous numbers nor the reasons for the change. What the filing does show is the shape of the year it now assumes: the first half delivered 45.5% of guided revenue, 40.9% of guided operating profit and 40.8% of guided net profit, which implies a second half of about ¥22,115 million of revenue and ¥5,441 million of operating profit — roughly 20% more revenue than the half just reported, at an operating margin near 24.6% against 20.4%. The company does not say what would drive that step-up.
The dividend is a first. Northsand paid nothing for FY1/2026, and for FY1/2027 it has declared no interim dividend but now forecasts a year-end payment of ¥35.00 per share, making ¥35.00 for the year against ¥0.00. On 69,000,000 shares that would return about ¥2,415 million, or roughly 35% of the ¥98.89 of earnings per share now guided. The interim results are outside the scope of review by the company's auditors, as the filing notes.
| Metric | H1 FY1/2027 | H1 FY1/2026 | Change |
|---|---|---|---|
| Revenue (¥ million) | 18,445 | 11,514 | +60.2% |
| Gross profit (¥ million) | 8,909 | 5,558 | +60.3% |
| Gross margin | 48.3% | 48.3% | 0.0 pt |
| SG&A expenses (¥ million) | 5,143 | 3,325 | +54.7% |
| Operating profit (¥ million) | 3,766 | 2,233 | +68.7% |
| Operating margin | 20.4% | 19.4% | +1.0 pt |
| Ordinary profit (¥ million) | 3,773 | 2,236 | +68.8% |
| Pre-tax profit (¥ million) | 3,771 | 2,236 | +68.6% |
| Income taxes (¥ million) | 988 | 675 | +46.4% |
| Net profit (¥ million) | 2,783 | 1,560 | +78.3% |
| EPS (¥) | 40.33 | 26.01 | +55.1% |
| Total assets (¥ million) | 24,376 | 21,861 | +11.5% |
| Net assets (¥ million) | 19,238 | 16,455 | +16.9% |
| Equity ratio | 78.9% | 75.3% | +3.6 pt |
| Cash and cash equivalents at period end (¥ million) | 13,389 | 14,597 | −8.3% |
| Net cash from operating activities (¥ million) | 1,913 | 1,156 | +65.5% |
| FY1/2027 guidance — revenue (¥ million) | 40,560 | — | +54.9% |
| FY1/2027 guidance — operating profit (¥ million) | 9,207 | — | +66.0% |
| FY1/2027 guidance — ordinary profit (¥ million) | 9,221 | — | +68.3% |
| FY1/2027 guidance — net profit (¥ million) | 6,823 | — | +68.6% |
| FY1/2027 guidance — EPS (¥) | 98.89 | — | — |
| Annual dividend per share (¥) | 35.00 | 0.00 | new |
JapanStockPulse provides informational content only and does not constitute investment advice. Figures are taken from the company's published earnings short report and may be subject to subsequent revision.