A tenfold rise in operating profit, from a very small base
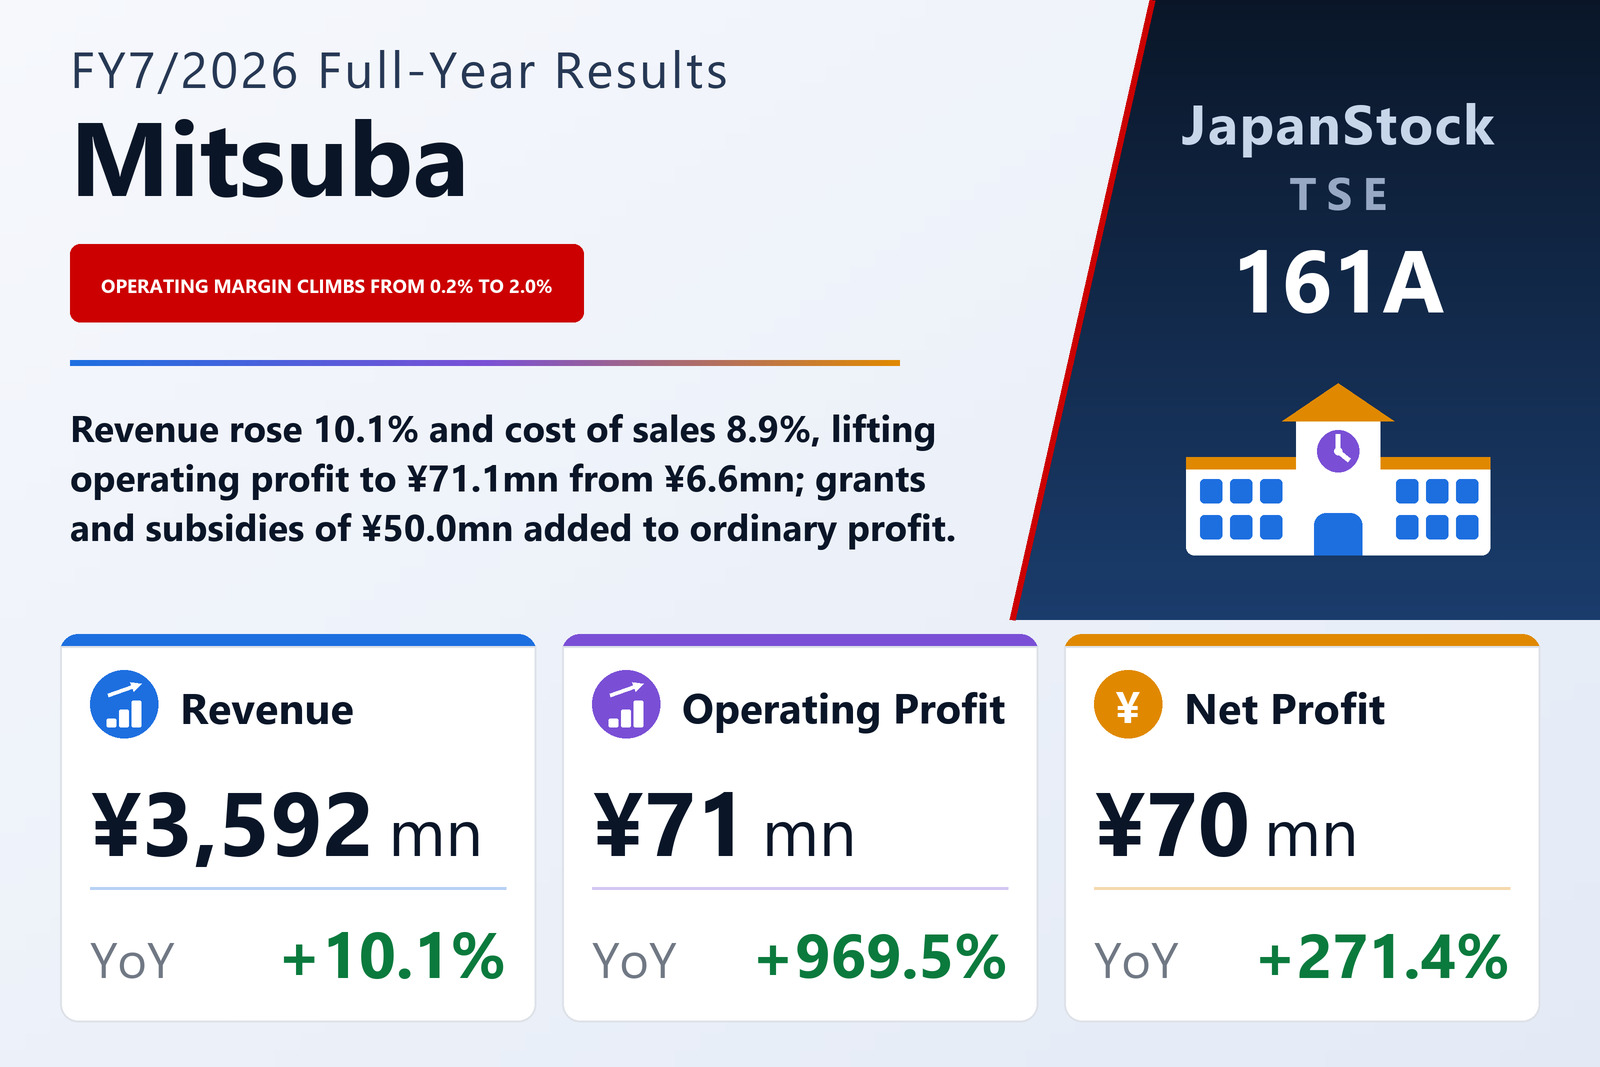
Mitsuba Co., Ltd. (TSE: 161A), a Kitakyushu-based group that runs child development support and after-school day facilities under the COMPASS brand alongside preschool education and a teaching-materials business for schools, published consolidated results for the fiscal year from August 1, 2025 to July 31, 2026 on September 14, 2026, under Japanese GAAP. Its shares trade on the Tokyo Stock Exchange's TOKYO PRO Market, which is open only to professional investors. Revenue rose 10.1% to ¥3,592.5 million, operating profit 969.5% to ¥71.1 million, ordinary profit 286.8% to ¥115.0 million and profit attributable to owners of the parent 271.4% to ¥71.0 million, or ¥71.00 per share against ¥19.12 on 1,000,000 shares. The group reports a single segment, education services, so the filing gives no revenue split by business. It holds its annual general meeting on October 28, 2026 and plans to file its annual Issuer Information report the same day.
The percentages are large because the base was tiny; the arithmetic behind them is modest. Cost of sales rose 8.9% to ¥2,861.7 million, a little more than a point slower than revenue, so gross profit grew 15.2% to ¥730.8 million and the gross margin widened from 19.4% to 20.3%. That added ¥96.6 million of gross profit. Selling, general and administrative expenses rose only 5.1%, or ¥32.1 million, to ¥659.7 million, leaving an operating-profit gain of ¥64.5 million. The operating margin moved from 0.2% to 2.0% — ten times the ratio, but still two yen of operating profit on every hundred yen of revenue.
Below the operating line, grants and subsidies do much of the work
Ordinary profit of ¥115.0 million was ¥43.9 million higher than operating profit, and grant and subsidy income alone exceeded that gap. Non-operating income nearly doubled to ¥55.6 million from ¥28.8 million: grant income was ¥25.3 million against ¥19.0 million and subsidy income ¥24.7 million against ¥6.2 million. Those two lines together, ¥50.0 million, equal about 70% of the year's operating profit; the filing does not say what the grants and subsidies were for. Interest expense rose to ¥9.4 million from ¥5.3 million. Below ordinary profit, damages received of ¥1.9 million were more than offset by an impairment loss of ¥3.3 million and ¥0.5 million of losses on the disposal of fixed assets, for pre-tax profit of ¥113.1 million against ¥31.6 million. Income taxes of ¥42.1 million, against ¥12.4 million, left net profit of ¥71.0 million, none of it attributable to non-controlling interests.
Operating profit fell well short of the company's own plan, and it says why
Mitsuba states plainly that operating profit came in well below its earlier forecast, and gives two reasons; this filing does not restate what that forecast was. First, having decided to raise staff bonus levels for its next fiscal period, the 38th, it reflected that policy in the fourth quarter and booked a bonus provision above its original plan: the provision rose from ¥21.0 million to ¥34.6 million, an increase of ¥13.6 million. Second, delays in opening some new facilities meant personnel and rent costs were incurred ahead of the openings. The company presents the bonus decision as an investment in recruiting, retaining and motivating staff rather than as a simple rise in costs.
119 sites, and a stated shift from adding facilities to making each one pay
During the year the group opened 13 new sites, four of them consultation support offices, taking the total to 119 at year-end: 97 children's day-support offices, 20 consultation support offices, one daily-life care office and one group home. The number of child development support centres — facilities intended to serve as a regional hub for support for children with disabilities — rose to 11, including two centres whose operation was entrusted to the group by Moriguchi City in Osaka Prefecture and Kita City in Tokyo. Management describes the year as a move from ‘increasing the number of facilities’ to ‘raising the profitability of each facility and business’, using facility-level break-even points that include shared costs, budget-versus-actual analysis and improvement guidance for unprofitable sites.
The filing also describes the smaller businesses and several non-financial measures, all on the company's own count. In preschool education, it says some leading schools drew more than half of their successful entrance-exam applicants from its students. Its teaching-materials business trades with 113 schools in Japan and supplies 301 Japanese schools and supplementary schools overseas. It reports more than 1,000 job applicants over the past year as of June and July 2026, at a recruitment cost below ¥100,000 per hire, and about 136,000 subscribers across its two YouTube channels at year-end. It also cites a support-outcome measure: between September 2013 and March 2026, 451 of the 3,587 children it supported returned their recipient certificate for disability day-support services. None of these activities is broken out in the accounts.
Cash flow turned positive and equity grew by half, from a thin base
Total assets rose ¥94.3 million to ¥1,383.6 million, mainly on higher accounts receivable (¥666.2 million against ¥605.8 million) and other receivables (¥109.3 million against ¥64.5 million). Liabilities rose ¥23.3 million to ¥1,168.8 million, chiefly through accrued expenses and income taxes payable. Net assets increased by the full year's profit, ¥71.0 million, to ¥214.8 million, as no dividend was paid, and the equity ratio improved from 11.2% to 15.5%. Borrowings — short-term loans plus long-term loans including the current portion — fell to ¥651.4 million from ¥751.1 million, against cash and deposits of ¥430.9 million.
Operating cash flow was an inflow of ¥117.6 million, against an outflow of ¥24.0 million a year earlier. Pre-tax profit of ¥113.1 million, depreciation of ¥18.1 million and a ¥17.8 million rise in other payables were partly absorbed by increases of ¥60.3 million in trade receivables and ¥44.8 million in other receivables. Investing activities used ¥71.0 million, including ¥44.0 million for property and equipment and ¥20.0 million placed in time deposits, so operating less investing cash flow came to about ¥46.6 million. Financing used ¥99.7 million, against a ¥350.0 million inflow the year before, as ¥166.4 million of long-term loans were repaid against ¥76.6 million of new ones and short-term loans fell by ¥10.0 million. Cash and equivalents ended the year at ¥370.8 million, down from ¥424.0 million.
Guidance: operating profit up 75%, ordinary profit up only 19.5%
For FY7/2027 Mitsuba guides revenue of ¥4,089.3 million (+13.8%), operating profit of ¥124.4 million (+75.0%), ordinary profit of ¥137.4 million (+19.5%) and profit attributable to owners of the parent of ¥82.6 million (+16.4%), or ¥82.63 per share, which implies an operating margin of about 3.0%. In that plan the gap between ordinary and operating profit narrows to about ¥12.9 million from ¥43.9 million this year, which is why the two lines grow at such different rates; the filing does not break down its non-operating assumptions. The company says it will slow the pace of new openings to some extent and concentrate on the utilisation and profitability of existing facilities, fixing unprofitable sites, rewarding staff, support quality and building up retained earnings and net assets. No dividend was paid for FY7/2026 and none is forecast for FY7/2027.
| Metric | FY7/2026 | FY7/2025 | Change |
|---|---|---|---|
| Revenue (¥ million) | 3,592 | 3,262 | +10.1% |
| Cost of sales (¥ million) | 2,861 | 2,628 | +8.9% |
| Gross profit (¥ million) | 730 | 634 | +15.2% |
| Gross margin | 20.3% | 19.4% | +0.9 pt |
| SG&A expenses (¥ million) | 659 | 627 | +5.1% |
| Operating profit (¥ million) | 71 | 6 | +969.5% |
| Operating margin | 2.0% | 0.2% | +1.8 pt |
| Non-operating income (¥ million) | 55 | 28 | +93.0% |
| Ordinary profit (¥ million) | 114 | 29 | +286.8% |
| Pre-tax profit (¥ million) | 113 | 31 | +258.3% |
| Net profit attrib. to owners of parent (¥ million) | 70 | 19 | +271.4% |
| EPS (¥) | 71.00 | 19.12 | +271.3% |
| Total assets (¥ million) | 1,383 | 1,289 | +7.3% |
| Net assets (¥ million) | 214 | 143 | +49.4% |
| Equity ratio | 15.5% | 11.2% | +4.3 pt |
| Borrowings (¥ million) | 651 | 751 | −13.3% |
| Operating cash flow (¥ million) | 117 | −23 | n.m. |
| Investing cash flow (¥ million) | −71 | −54 | n.m. |
| Financing cash flow (¥ million) | −99 | 349 | n.m. |
| Cash and equivalents at period end (¥ million) | 370 | 423 | −12.5% |
| FY7/2027 guidance — revenue (¥ million) | 4,089 | — | +13.8% |
| FY7/2027 guidance — operating profit (¥ million) | 124 | — | +75.0% |
| FY7/2027 guidance — ordinary profit (¥ million) | 137 | — | +19.5% |
| FY7/2027 guidance — net profit (¥ million) | 82 | — | +16.4% |
| FY7/2027 guidance — EPS (¥) | 82.63 | — | — |
| Annual dividend per share (¥) | 0.00 | 0.00 | unchanged |
JapanStockPulse provides informational content only and does not constitute investment advice. Figures are taken from the company's published earnings short report and may be subject to subsequent revision.