Revenue up 54% on a steadily growing club network
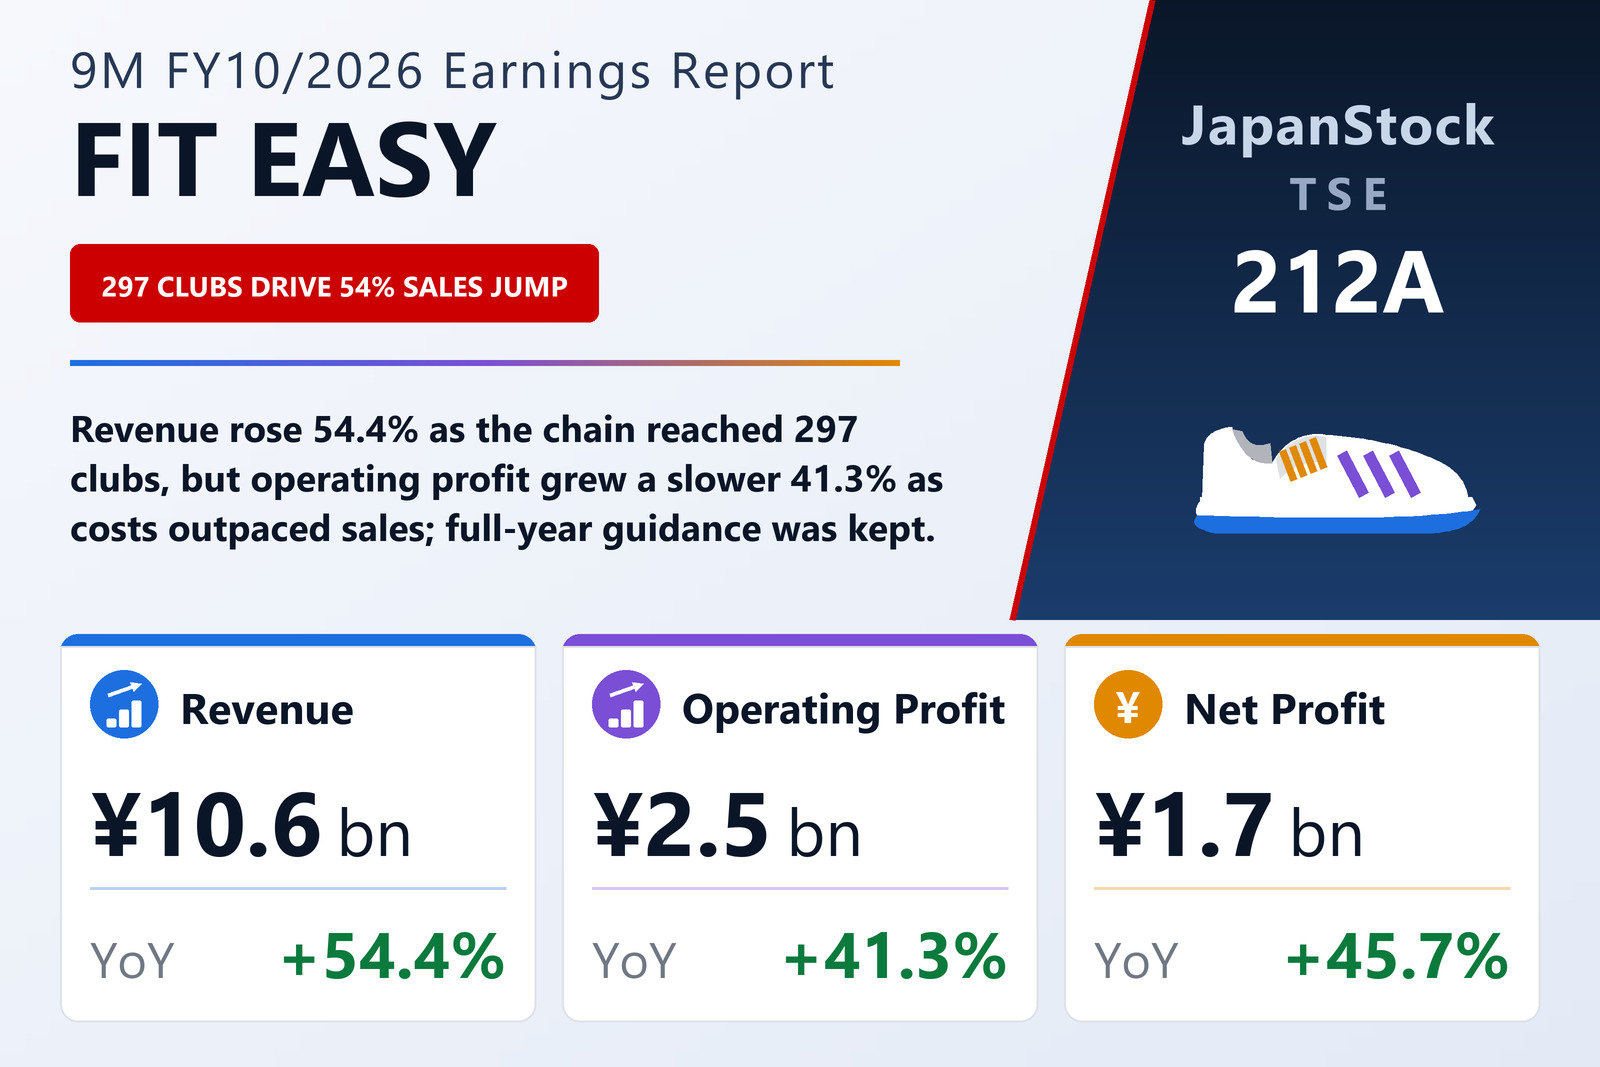
FIT EASY Co., Ltd. (TSE: 212A), which runs the FIT EASY chain of “amusement fitness clubs” across Japan, published non-consolidated results for the first nine months of its fiscal year ending October 2026 — November 1, 2025 to July 31, 2026 — on September 14, 2026, under Japanese GAAP. Revenue rose 54.4% to ¥10,623 million, operating profit 41.3% to ¥2,507 million, ordinary profit 42.7% to ¥2,535 million and net profit 45.7% to ¥1,725 million. Earnings per share were ¥103.79 against ¥74.63, or ¥101.56 against ¥72.40 on a diluted basis. The shares are listed on the Tokyo Stock Exchange and the Nagoya Stock Exchange.
The company attributes the result to continued new openings — it passed 250 clubs in January 2026 and kept opening after that — together with effective campaigns and efforts to raise member satisfaction. At the end of July 2026 it operated 297 clubs with 292,000 members. Its clubs combine fitness machines with 28 kinds of amusement services, including studios, high-concentration oxygen rooms, golf, lounges, saunas and self-service beauty treatments, and it presents them as a “third place” that is neither home nor work. It also offers a FIT EASY app built on what it calls AI healthcare automation, for which it says it has received a decision to grant a patent and paid the patent fee, with no patent number assigned yet. The company reports a single segment, fitness club operation, so the filing gives no segment breakdown.
Costs grew faster than sales, so margins narrowed
Growth came with thinner margins. Cost of sales rose 57.2% to ¥6,864 million, faster than revenue, so gross profit rose a smaller 49.5% to ¥3,759 million and the gross margin slipped from 36.5% to 35.4%. Selling, general and administrative expenses grew 69.0% to ¥1,251 million, lifting their share of revenue from 10.8% to 11.8%. The operating margin therefore fell from 25.8% to 23.6%, even as operating profit rose by ¥733 million. Depreciation rose 60.1% to ¥216 million from ¥135 million. The filing does not break down cost of sales or SG&A and gives no reason for the lower margins.
Higher interest income below the operating line, and no extraordinary items
Non-operating income more than tripled to ¥33 million from ¥10 million; its largest item, interest received, rose to ¥18 million from ¥3 million. Non-operating expenses fell to ¥5 million from ¥7 million, with interest paid down to ¥3 million from ¥4 million. Ordinary profit therefore grew slightly faster than operating profit, by 42.7% to ¥2,535 million. There were no extraordinary gains or losses, so pre-tax profit equalled ordinary profit.
Income taxes, which the company calculates by applying an estimated effective rate for the full year, rose 36.6% to ¥809 million. That was about 31.9% of pre-tax profit against 33.3% a year earlier, which let net profit grow 45.7% to ¥1,725 million. Earnings per share grew a slower 39.1%, because the average number of shares outstanding rose to 16,627,958 from 15,870,923.
Deposits and member-related liabilities grew with the network
Total assets rose ¥1,514 million to ¥11,577 million from October 31, 2025. The company points mainly to increases of ¥535 million in guarantee deposits paid, ¥550 million in other current assets and ¥501 million in other investments and other assets. Cash and deposits fell ¥636 million to ¥2,638 million. Liabilities rose ¥632 million to ¥4,816 million, chiefly because guarantee deposits received rose ¥497 million to ¥1,360 million and contract liabilities ¥302 million to ¥643 million, while income taxes payable fell ¥207 million to ¥417 million. Bonds and borrowings, including current portions, came down to ¥275 million from ¥427 million.
Net assets rose ¥881 million to ¥6,761 million: net profit added ¥1,725 million to retained earnings, while dividends took out ¥847 million. The equity ratio was unchanged at 58.4%. No cash-flow statement was prepared for the period.
Guidance unchanged, and it asks for a stronger fourth quarter
FIT EASY left its full-year FY10/2026 guidance, published on June 12, 2026, unchanged: revenue of ¥14,322 million (+47.2%), operating profit of ¥3,506 million (+51.7%), ordinary profit of ¥3,558 million (+53.5%) and net profit of ¥2,473 million (+61.8%), or ¥148.58 per share. The nine months delivered 74.2% of guided revenue, 71.5% of guided operating profit and 69.8% of guided net profit. That implies a fourth quarter of about ¥3,699 million of revenue and ¥999 million of operating profit — an operating margin of roughly 27%, above the 23.6% of the nine months — and about ¥747 million of net profit. The guided full-year growth rates for operating and net profit are also higher than the nine-month rates. The filing gives no quarterly breakdown and does not comment on that shape.
The dividend forecast is also unchanged. FIT EASY paid an interim dividend of ¥26, made up of an ordinary ¥20 and a ¥6 commemorative dividend marking its move to the TSE Prime and Nagoya Stock Exchange Premier markets, and expects a year-end dividend of ¥25, for an annual total of ¥51 against ¥25 for FY10/2025, when no interim dividend was paid. Against guided earnings of ¥148.58 per share, that is a payout of about 34%. The company describes an economy in which consumer spending is picking up but the outlook remains uncertain, citing higher energy and raw-material costs, rising consumer prices and higher interest rates worldwide, and says fitness-club customers increasingly see spending on their health as a worthwhile investment rather than a mere expense.
| Metric | 9M FY10/2026 | 9M FY10/2025 | Change |
|---|---|---|---|
| Revenue (¥ million) | 10,623 | 6,881 | +54.4% |
| Gross profit (¥ million) | 3,759 | 2,514 | +49.5% |
| Gross margin | 35.4% | 36.5% | −1.1 pt |
| SG&A expenses (¥ million) | 1,251 | 740 | +69.0% |
| Operating profit (¥ million) | 2,507 | 1,774 | +41.3% |
| Operating margin | 23.6% | 25.8% | −2.2 pt |
| Non-operating income (¥ million) | 33 | 10 | +222.5% |
| Ordinary profit (¥ million) | 2,535 | 1,777 | +42.7% |
| Income taxes (¥ million) | 809 | 592 | +36.6% |
| Net profit (¥ million) | 1,725 | 1,184 | +45.7% |
| EPS (¥) | 103.79 | 74.63 | +39.1% |
| Diluted EPS (¥) | 101.56 | 72.40 | +40.3% |
| Depreciation (¥ million) | 216 | 135 | +60.1% |
| Total assets (¥ million) | 11,577 | 10,063 | +15.0% |
| Cash and deposits (¥ million) | 2,638 | 3,274 | −19.4% |
| Guarantee deposits paid (¥ million) | 1,965 | 1,429 | +37.5% |
| Contract liabilities (¥ million) | 643 | 341 | +88.6% |
| Guarantee deposits received (¥ million) | 1,360 | 863 | +57.6% |
| Net assets (¥ million) | 6,761 | 5,880 | +15.0% |
| Equity ratio | 58.4% | 58.4% | unchanged |
| FY10/2026 guidance — revenue (¥ million) | 14,322 | — | +47.2% |
| FY10/2026 guidance — operating profit (¥ million) | 3,506 | — | +51.7% |
| FY10/2026 guidance — ordinary profit (¥ million) | 3,558 | — | +53.5% |
| FY10/2026 guidance — net profit (¥ million) | 2,473 | — | +61.8% |
| FY10/2026 guidance — EPS (¥) | 148.58 | — | — |
| Annual dividend per share (¥) | 51.00 | 25.00 | +104.0% |
JapanStockPulse provides informational content only and does not constitute investment advice. Figures are taken from the company's published earnings short report and may be subject to subsequent revision.