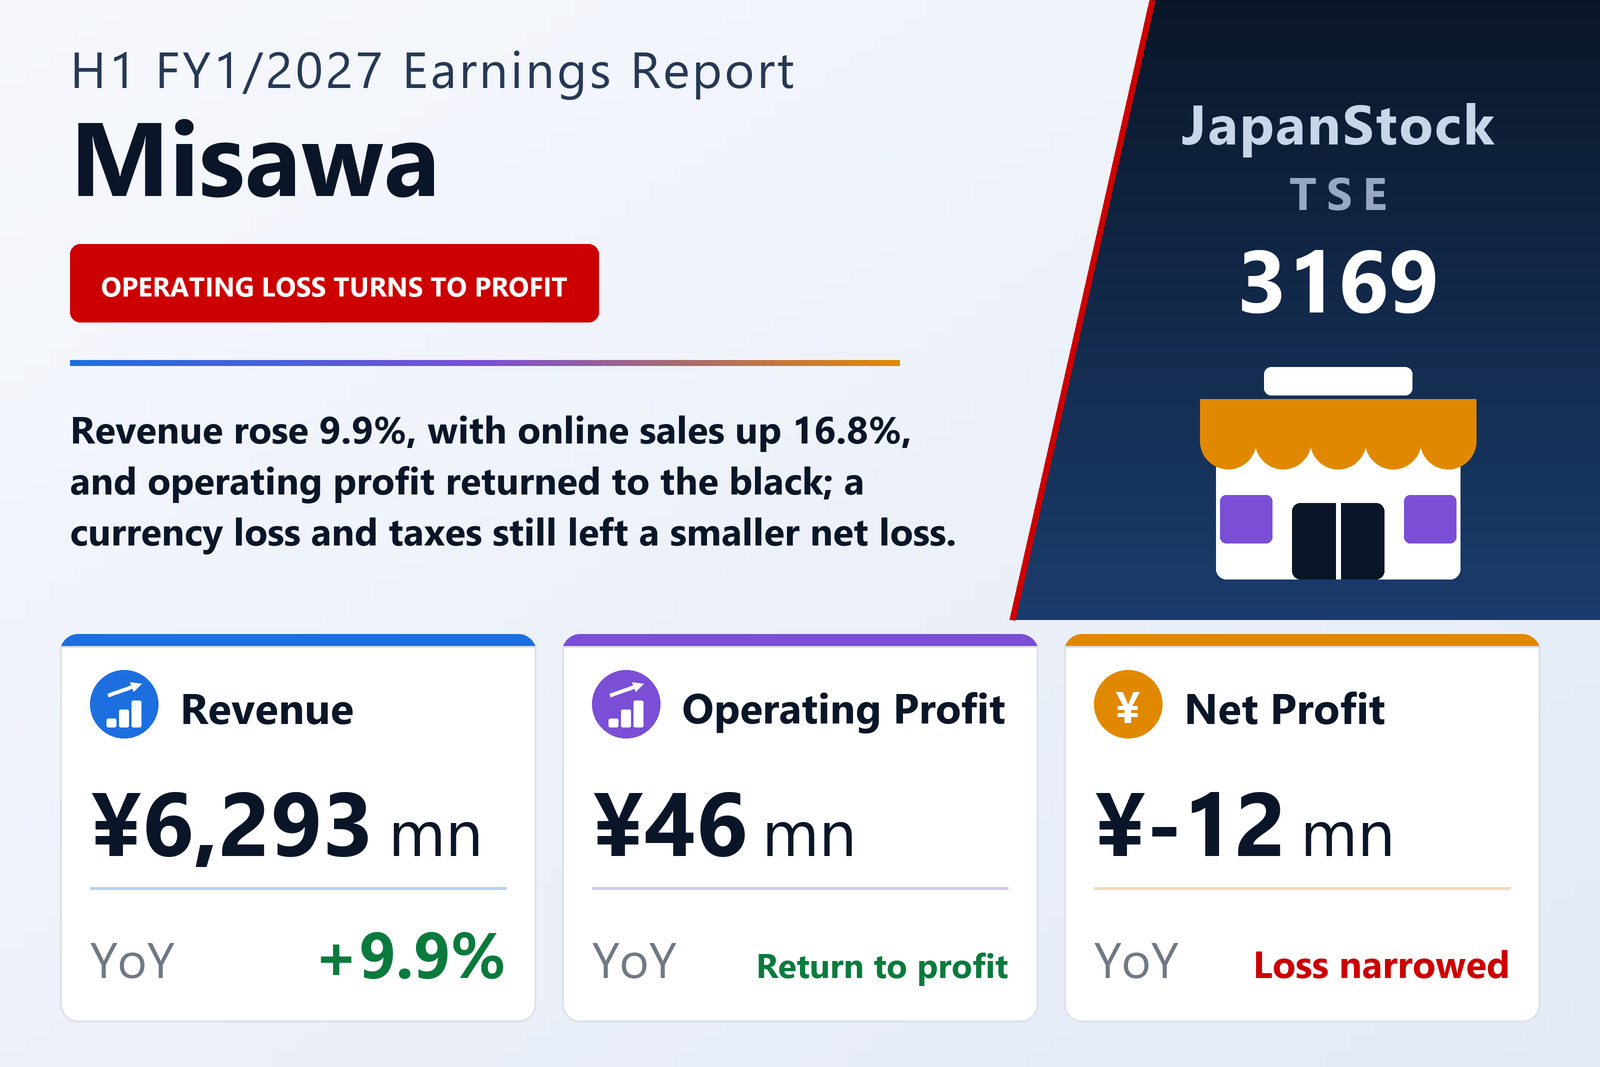
Revenue up 9.9%, and an operating loss turned into a small profit
Misawa & Co., Ltd. (TSE: 3169), the Tokyo-based company behind the unico furniture and interior brand, published non-consolidated results for the first half of FY1/2027 — the six months from February 1 to July 31, 2026 — on September 14, 2026 under Japanese GAAP. Its shares are listed on the Tokyo Stock Exchange. Revenue rose 9.9% to ¥6,293 million, operating profit was ¥46 million against a loss of ¥75 million, ordinary profit ¥13 million against a loss of ¥62 million, and the interim net loss narrowed to ¥12 million from ¥59 million, a loss per share of ¥1.77 against ¥8.44. The company reports a single segment, the unico business, so there is no segment breakdown, and the interim statements were not reviewed by an auditor.
The filing is short: summary figures, the financial statements and a note splitting revenue by sales channel. It carries no qualitative discussion of the half, so it states no cause for any of the movements set out below, and none is supplied here.
The operating turnaround is simple arithmetic. Revenue grew by about ¥568 million, but cost of sales grew faster, 12.6% to ¥3,206 million, so gross profit rose only 7.3% to ¥3,086 million and the gross margin slipped from 50.3% to 49.0%. Selling, general and administrative expenses rose just 2.9% to ¥3,039 million, which cut their share of revenue from 51.6% to 48.3%. About ¥209 million more gross profit against about ¥86 million more overhead is the whole of the roughly ¥123 million swing at the operating line, and it took the operating margin from −1.3% to 0.7%. The filing does not say why cost of sales outpaced revenue.
E-commerce grew twice as fast as the stores
The revenue note divides sales into two channels. Stores brought in ¥5,042 million, up 8.3%, and e-commerce ¥1,251 million, up 16.8%. Online's share of revenue therefore rose from 18.7% to 19.9%, though stores still account for about four-fifths of the total. Of the roughly ¥568 million increase in revenue, about ¥388 million came from stores and about ¥180 million from e-commerce. The filing gives no store count and no like-for-like figures, so it is not possible to say how much of the store growth came from new locations.
Below the operating line, a currency loss and taxes absorbed the gain
Ordinary profit was only ¥13 million, well below operating profit, because non-operating items turned against the company. A year earlier they added a net ¥13.7 million, helped by a foreign-exchange gain of ¥6.5 million; this half they cost a net ¥33.3 million, led by a foreign-exchange loss of ¥36.7 million. Interest expense rose to ¥1.9 million from ¥0.3 million, and non-operating income of ¥6.9 million included ¥4.7 million of insurance proceeds for transport accidents. The filing does not say what exposure produced the currency loss. There were no extraordinary items, so pre-tax profit equalled ordinary profit.
Taxes then took more than the pre-tax profit. Current income taxes were ¥38.8 million and a deferred-tax credit of ¥12.6 million brought the total to ¥26.2 million, almost twice the ¥13.6 million pre-tax figure, against a tax credit of ¥2.6 million a year earlier. That is what turned an ordinary profit into an interim net loss of ¥12.6 million in the income statement. The filing gives no breakdown explaining the size of the charge relative to profit.
Cash flow turned positive as receivables fell and advance receipts rose
Operating cash flow was ¥181 million against an outflow of ¥173 million a year earlier. The statement shows receivables falling by ¥154.7 million, contract liabilities rising by ¥128.8 million and payables by ¥68.0 million, while inventory absorbed ¥138.0 million and other items ¥190.8 million. Depreciation rose to ¥102.8 million from ¥59.0 million, and income taxes paid fell to ¥19.7 million from ¥113.1 million. Investing outflows shrank to ¥56.3 million from ¥280.5 million, mainly because spending on intangible assets fell to ¥51.0 million from ¥209.3 million and on tangible assets to ¥12.2 million from ¥71.3 million. Financing used ¥103.8 million — ¥44.6 million of loan repayments, ¥56.5 million of dividends and ¥2.8 million of treasury-share purchases — with no new borrowing, against ¥300 million borrowed a year earlier. Cash and deposits ended at ¥1,379 million, up ¥21 million.
Total assets were ¥5,505 million at July 31, 2026, against ¥5,517 million at January 31, 2026. Merchandise inventory rose 8.4% to ¥1,717 million, accounts receivable fell to ¥512 million from ¥667 million, and contract liabilities rose 16.1% to ¥928 million. Long-term borrowings, including the current portion, fell to ¥256 million from ¥301 million. Net assets declined 1.3% to ¥3,197 million as retained earnings fell by about ¥69 million — roughly the dividend paid plus the net loss — and the equity ratio eased from 58.7% to 58.1%. Treasury shares fell to 8,636 from 50,936; the filing does not describe how the difference was disposed of.
Guidance unchanged, and it leans heavily on the second half
Misawa left its FY1/2027 forecast unchanged: revenue of ¥12,752 million (+4.9%), operating profit of ¥246 million (+4.7%), ordinary profit of ¥257 million (+1.6%) and net profit of ¥172 million (+38.0%), for earnings per share of ¥24.35. The first half delivered 49.4% of guided revenue but only about 19% of guided operating profit and about 5% of guided ordinary profit, and a net loss rather than a share of the guided net profit. Meeting the forecast therefore implies a second half of about ¥6,459 million in revenue, about ¥199 million in operating profit and about ¥185 million in net profit — a far more profitable six months on slightly higher sales. The filing does not explain that weighting.
The dividend forecast was not revised either. As a year earlier, no interim dividend was paid, and a year-end dividend of ¥8.00 is forecast, for an annual total of ¥8.00, unchanged from FY1/2026. Against guided earnings of ¥24.35 per share that is a payout of about 33%. The ¥56.5 million of dividends paid in the half was the FY1/2026 year-end dividend.
| Metric | H1 FY1/2027 | H1 FY1/2026 | Change |
|---|---|---|---|
| Revenue (¥ million) | 6,293 | 5,725 | +9.9% |
| Store sales (¥ million) | 5,042 | 4,654 | +8.3% |
| E-commerce sales (¥ million) | 1,251 | 1,070 | +16.8% |
| Gross profit (¥ million) | 3,086 | 2,877 | +7.3% |
| Gross margin | 49.0% | 50.3% | −1.3 pt |
| SG&A expenses (¥ million) | 3,039 | 2,953 | +2.9% |
| Operating profit (¥ million) | 46 | −75 | loss to profit |
| Operating margin | 0.7% | −1.3% | +2.0 pt |
| Foreign-exchange gain / loss (¥ million) | −36 | 6 | n.m. |
| Ordinary profit (¥ million) | 13 | −62 | loss to profit |
| Pre-tax profit (¥ million) | 13 | −62 | loss to profit |
| Income taxes (¥ million) | 26 | −2 | n.m. |
| Net profit (¥ million) | −12 | −59 | loss narrowed |
| EPS (¥) | −1.77 | −8.44 | loss narrowed |
| Operating cash flow (¥ million) | 181 | −173 | n.m. |
| Total assets (¥ million) | 5,505 | 5,517 | −0.2% |
| Cash and deposits (¥ million) | 1,379 | 1,358 | +1.5% |
| Merchandise inventory (¥ million) | 1,717 | 1,584 | +8.4% |
| Contract liabilities (¥ million) | 928 | 799 | +16.1% |
| Net assets (¥ million) | 3,197 | 3,240 | −1.3% |
| Equity ratio | 58.1% | 58.7% | −0.6 pt |
| FY1/2027 guidance — revenue (¥ million) | 12,752 | — | +4.9% |
| FY1/2027 guidance — operating profit (¥ million) | 246 | — | +4.7% |
| FY1/2027 guidance — ordinary profit (¥ million) | 257 | — | +1.6% |
| FY1/2027 guidance — net profit (¥ million) | 172 | — | +38.0% |
| FY1/2027 guidance — EPS (¥) | 24.35 | — | — |
| Annual dividend per share (¥) | 8.00 | 8.00 | unchanged |
JapanStockPulse provides informational content only and does not constitute investment advice. Figures are taken from the company's published earnings short report and may be subject to subsequent revision.