Revenue grew 21.1%, but both cost lines grew slightly faster
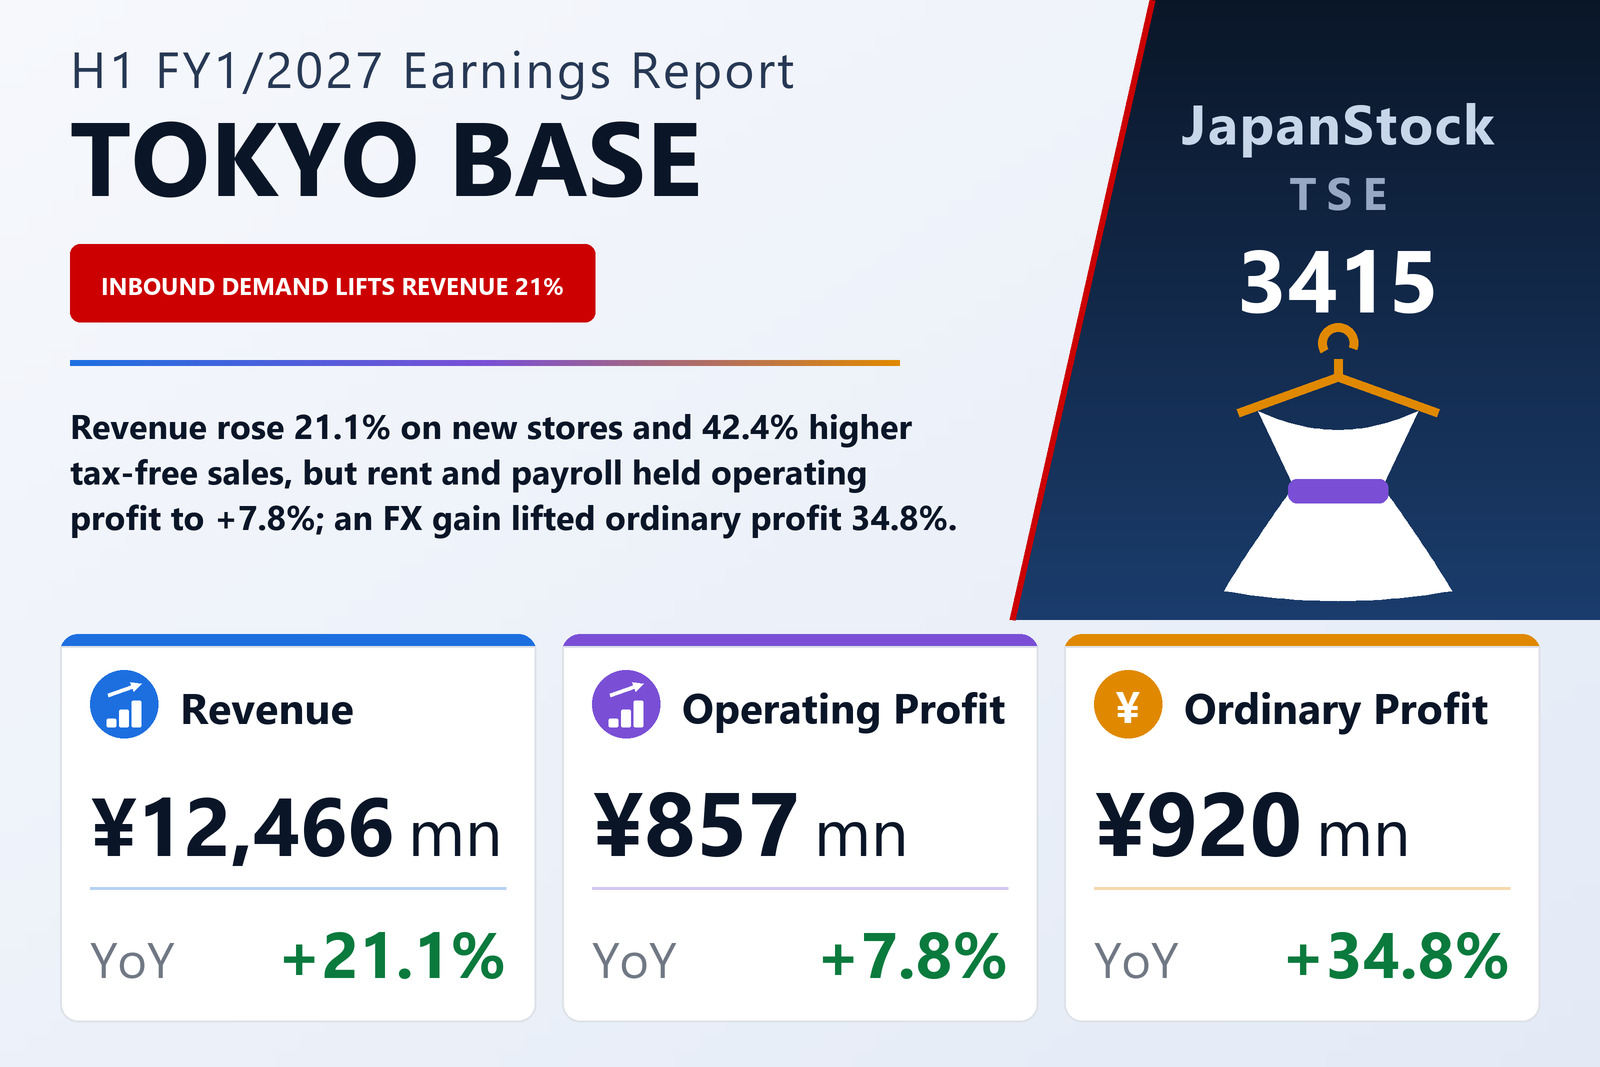
TOKYO BASE Co., Ltd. (TSE: 3415), the apparel retailer whose store formats include STUDIOUS, UNITED TOKYO and PUBLIC TOKYO, published consolidated results for the first half of the fiscal year ending January 31, 2027 — the six months from February 1 to July 31, 2026 — on September 14, 2026, under Japanese GAAP. Revenue rose 21.1% to ¥12,466 million, operating profit 7.8% to ¥857 million, ordinary profit 34.8% to ¥920 million and profit attributable to owners of the parent 11.9% to ¥518 million, for earnings of ¥11.93 per share against ¥10.66. The company is listed on the Tokyo Stock Exchange; its half-year results were not subject to review by an auditor.
The gap between the first two growth rates is where the half was decided. Cost of sales rose 22.2% to ¥5,786 million, a little faster than revenue, so gross profit grew 20.2% to ¥6,680 million and the gross margin slipped from 54.0% to 53.6%. Selling, general and administrative expenses also rose 22.2%, to ¥5,822 million, lifting their ratio to revenue from 46.3% to 46.7%. With both cost lines outpacing revenue, the operating margin narrowed from 7.7% to 6.9%, and ¥2,173 million of additional revenue produced only about ¥62 million of additional operating profit.
New formats, inventory clearance and store costs squeezed the margin
The filing gives three reasons for the lower gross margin: introductory-phase selling tied to the launch of a new format, a shift in the format mix as the store network expanded, and the sale of some merchandise on ZOZOTOWN to reduce inventory built up in earlier years. It says inventory levels were brought closer to where they should be; the balance sheet nonetheless shows merchandise up ¥536 million to ¥4,197 million over the six months, a period in which the store count also rose by twelve. On the expense side, rent rose by ¥346 million with new stores, salaries and allowances by ¥185 million as the company added staff, and sales commissions by ¥93 million with the larger network; the filing says these account for most of the ¥1,059 million increase in selling, general and administrative expenses.
Tax-free sales supplied most of the store growth
Store sales rose 17.5% to ¥9,184 million and e-commerce sales 35.5% to ¥2,166 million. Within the stores, tax-free sales at domestic locations reached ¥3,396 million, up 42.4% from ¥2,384 million, lifting their share of store sales from 30.1% to 36.4%. The filing calculates that the ¥1,012 million increase in tax-free sales equals 72.0% of the rise in store sales, and that tax-free sales beat the prior year in every month of the half, with May at 152.2% and June at 155.0% of the year-earlier level. Against the same period two years earlier, when they were ¥1,603 million, they are 2.1 times as large.
Every format grew. STUDIOUS, the largest, rose 18.2% to ¥5,012 million; UNITED TOKYO 8.6% to ¥3,048 million; PUBLIC TOKYO 1.0% to ¥1,479 million; THE TOKYO 54.2% to ¥1,370 million; CONZ 148.8% to ¥617 million; CITY 5.0% to ¥425 million; JAPAN EDITION 83.1% to ¥161 million; and RITAN 63.4% to ¥146 million. KEY TIMEZ, launched during the half, added ¥371 million, and a negative ¥165 million of other items, mainly revenue-recognition adjustments, reconciles the formats to the group total. On a same-store basis, however, the company-wide figure was 105.7% of the prior year: THE TOKYO (119.2%), CONZ (118.9%) and STUDIOUS (111.9%) led, while UNITED TOKYO (101.1%), PUBLIC TOKYO (89.0%) and CITY (90.3%) left the company's own original-brand formats below the prior year in aggregate. The filing says plainly that the half's growth came mainly from new stores and the new format, and names the recovery of existing-store earnings in those original-brand formats as its next task.
The store count rose from 104 at January 31, 2026 to 116 at July 31, with 20 openings — eight of them KEY TIMEZ, including two e-commerce stores — against eight closures. Of the 116, 103 are physical stores: 87 in Japan and 16 overseas. In Hong Kong the company opened four stores and closed one, and says the business there is growing ahead of plan. In mainland China it had finished closing unprofitable stores by the previous year and has concentrated on Shanghai, Beijing, Shenzhen and Guangzhou, where it says existing-store sales are recovering.
A currency swing, not trading, lifted ordinary profit
Ordinary profit rose 34.8%, far ahead of operating profit's 7.8%, because the non-operating account swung. Non-operating income rose to ¥112 million from ¥13 million, mainly on a foreign-exchange gain of ¥91 million, while non-operating expenses fell to ¥49 million from ¥125 million, chiefly because the prior half had carried a ¥102 million foreign-exchange loss. Net non-operating items therefore moved from a charge of about ¥112 million to a gain of about ¥63 million — a swing of roughly ¥175 million, nearly three times the improvement at the operating line. Interest expense, by contrast, roughly doubled, to ¥45 million from ¥23 million. The company says it uses forward exchange contracts to manage currency risk.
Below ordinary profit, the gain narrowed again. Extraordinary losses of ¥70 million — an impairment of ¥67 million and ¥2 million of fixed-asset disposals — arose mainly because a renovation of the Ikebukuro PARCO building moved the PUBLIC TOKYO and CITY floors, leaving the fixed assets of the old stores to be written down. Pre-tax profit rose 24.6% to ¥850 million. Income taxes rose 51.6% to ¥332 million, taking the tax charge from 32.1% to 39.1% of pre-tax profit; the company calculates the interim charge by applying an estimated effective rate for the full year. Profit attributable to owners therefore grew 11.9%. Comprehensive income fell 8.2% to ¥553 million, because the foreign-currency translation adjustment added ¥35 million against ¥139 million a year earlier.
A buyback, dividends and inventory drew cash down
Total assets rose 2.9% to ¥15,294 million from January 31, 2026. Cash and deposits fell ¥873 million to ¥3,523 million, while merchandise rose ¥536 million, property, plant and equipment ¥395 million and guarantee deposits ¥268 million. Net assets fell 3.3% to ¥6,059 million: retained earnings grew ¥254 million after ¥518 million of profit and ¥263 million of dividends, but treasury stock increased by ¥499 million after the company bought back 1,341,100 shares under a board resolution of May 18, 2026. The equity ratio fell from 42.0% to 39.5%. Liabilities rose ¥637 million to ¥9,235 million, including ¥200 million more short-term borrowing, now ¥2,100 million. That equals the full limit of the company's overdraft facilities, which was ¥2,100 million at July 31 against ¥2,400 million at January 31, leaving no undrawn balance against ¥500 million before.
Operating activities generated ¥546 million of cash, against an outflow of ¥185 million a year earlier. Pre-tax profit of ¥850 million and depreciation of ¥329 million were offset by a ¥508 million increase in inventories (¥1,291 million a year earlier), ¥402 million of income taxes paid and a ¥93 million decrease in payables. Investing used ¥740 million, chiefly ¥309 million of guarantee deposits, ¥257 million of property, plant and equipment and a ¥100 million loan to affiliated companies. Financing used ¥710 million: ¥1,303 million of long-term loan repayments, the ¥499 million buyback and ¥263 million of dividends, partly offset by ¥1,300 million of new long-term borrowing.
Guidance unchanged, leaving a heavier second half
The full-year FY1/2027 forecast published on March 17, 2026 was left unchanged: revenue of ¥28,000 million (+17.4%), operating profit of ¥2,500 million (+26.8%), ordinary profit of ¥2,200 million (+16.4%) and profit attributable to owners of ¥1,500 million (+29.9%), or ¥34.12 per share. The company manages its performance on an annual basis and does not publish a half-year forecast. The first half delivered 44.5% of guided revenue but 34.3% of guided operating profit, along with 41.9% of guided ordinary profit and 34.5% of guided net profit. Meeting the targets implies second-half revenue of about ¥15,534 million and operating profit of about ¥1,643 million — an operating margin near 10.6%, against 6.9% in the first half. Guided ordinary profit is also ¥300 million below guided operating profit, which implies net non-operating costs in the second half after a net gain in the first. The filing explains neither assumption.
The dividend forecast is also unrevised: no interim dividend, and a year-end dividend of ¥7.00 per share against ¥6.00 for FY1/2026, an increase of 16.7% and about 20.5% of guided earnings per share.
| Metric | H1 FY1/2027 | H1 FY1/2026 | Change |
|---|---|---|---|
| Revenue (¥ million) | 12,466 | 10,293 | +21.1% |
| Gross profit (¥ million) | 6,680 | 5,559 | +20.2% |
| Gross margin | 53.6% | 54.0% | −0.4 pt |
| SG&A expenses (¥ million) | 5,822 | 4,763 | +22.2% |
| Operating profit (¥ million) | 857 | 795 | +7.8% |
| Operating margin | 6.9% | 7.7% | −0.8 pt |
| Non-operating income (¥ million) | 112 | 13 | +744.7% |
| Non-operating expenses (¥ million) | 49 | 125 | −60.4% |
| Ordinary profit (¥ million) | 920 | 683 | +34.8% |
| Extraordinary losses (¥ million) | 70 | 1 | n.m. |
| Pre-tax profit (¥ million) | 850 | 682 | +24.6% |
| Net profit attrib. to owners of parent (¥ million) | 518 | 463 | +11.9% |
| EPS (¥) | 11.93 | 10.66 | +11.9% |
| Tax-free sales at domestic stores (¥ million) | 3,396 | 2,384 | +42.4% |
| Total assets (¥ million) | 15,294 | 14,863 | +2.9% |
| Net assets (¥ million) | 6,059 | 6,266 | −3.3% |
| Equity ratio | 39.5% | 42.0% | −2.5 pt |
| Operating cash flow (¥ million) | 546 | −185 | n.m. |
| FY1/2027 guidance — revenue (¥ million) | 28,000 | — | +17.4% |
| FY1/2027 guidance — operating profit (¥ million) | 2,500 | — | +26.8% |
| FY1/2027 guidance — ordinary profit (¥ million) | 2,200 | — | +16.4% |
| FY1/2027 guidance — net profit (¥ million) | 1,500 | — | +29.9% |
| FY1/2027 guidance — EPS (¥) | 34.12 | — | — |
| Annual dividend per share (¥) | 7.00 | 6.00 | +16.7% |
JapanStockPulse provides informational content only and does not constitute investment advice. Figures are taken from the company's published earnings short report and may be subject to subsequent revision.