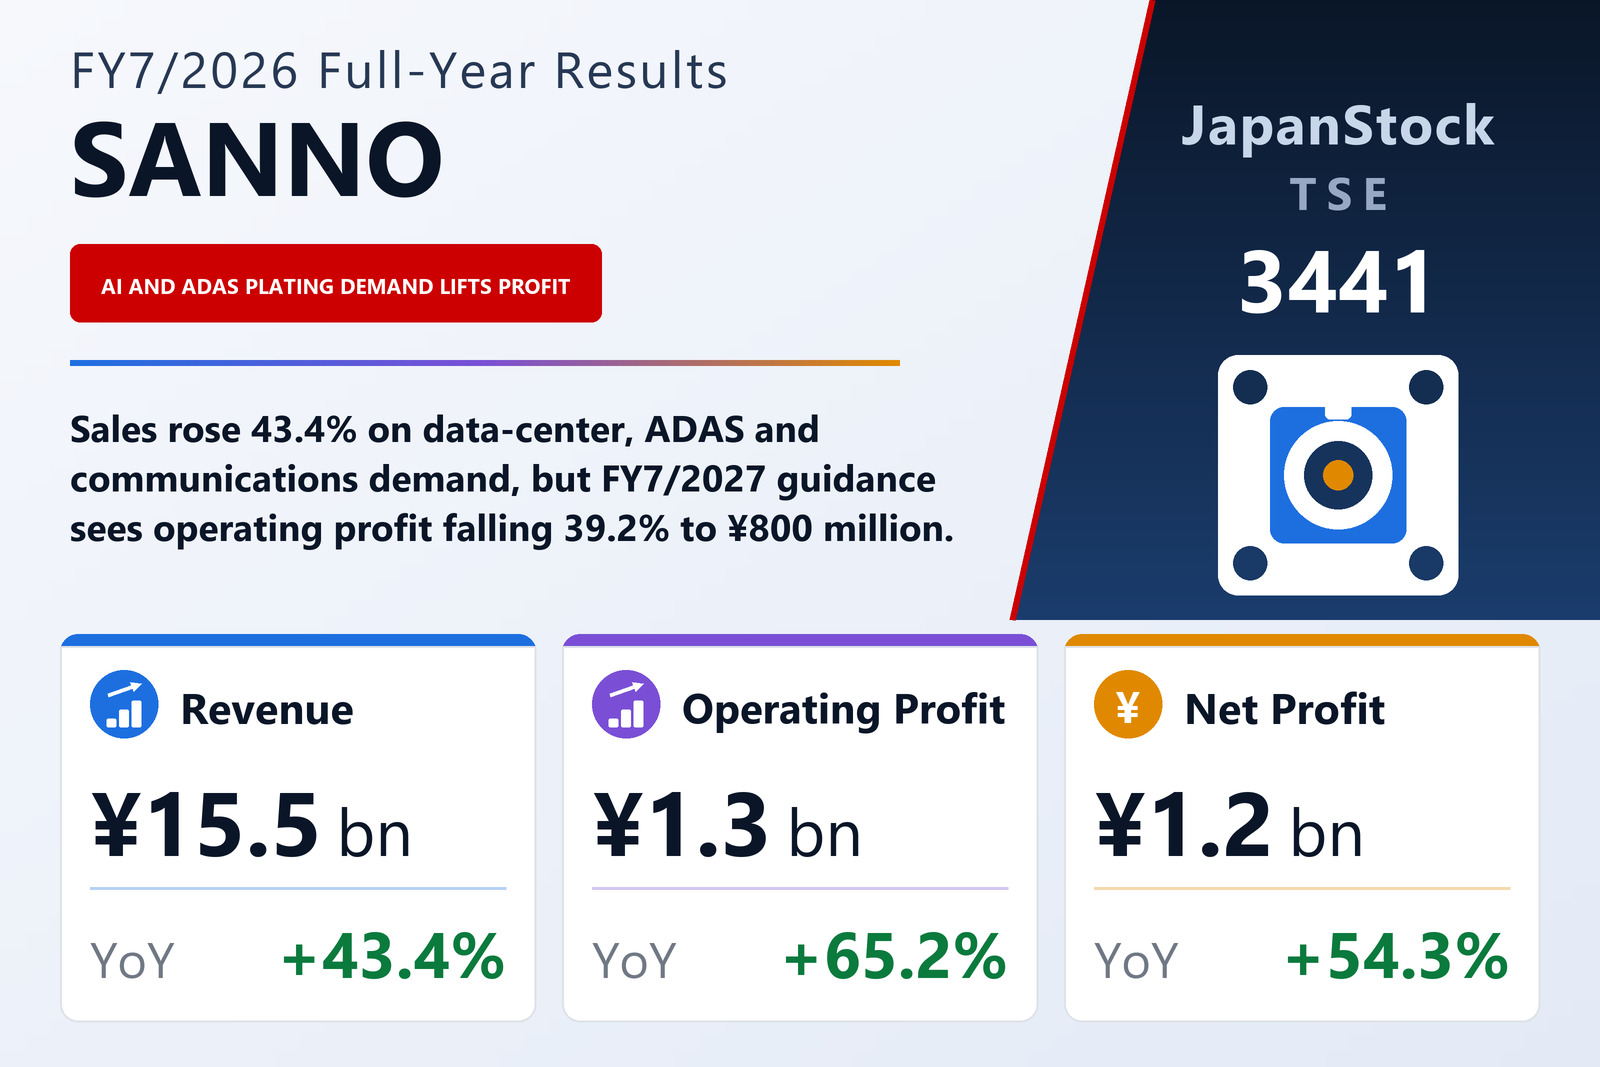
Sales up 43%, operating profit up 65%
SANNO Co., Ltd. (TSE: 3441), which carries out precious-metal plating, precision pressing and insert moulding for electronic components such as connectors and switches, published consolidated results for the fiscal year from August 1, 2025 to July 31, 2026 on September 14, 2026 under Japanese GAAP. Net sales rose 43.4% to ¥15,531 million, operating profit 65.2% to ¥1,315 million, ordinary profit 63.6% to ¥1,319 million and net profit attributable to owners of the parent 54.3% to ¥1,181 million. Earnings per share were ¥274.75 against ¥172.65, and return on equity was 16.0% against 11.6%. The shares are listed in Tokyo and Nagoya.
The company describes a year in which demand from industrial equipment kept expanding on the back of generative AI and data centers, while the automotive and communications fields were broadly firm. It says it pursued orders in growth areas — automotive ADAS, semiconductors, AI servers, data-center equipment and smartphones — and revised prices to reflect higher raw-material and other costs. Explaining the parent company's own result, it points to strong industrial-equipment orders tied to generative-AI data centers, expanding ADAS demand in automotive and steady PC and tablet business in communications. It also brought a new plating line into operation and strengthened a single order structure covering pressing, plating and insert moulding.
A thinner gross margin, and a depreciation change worth ¥153 million
Cost of sales rose faster than revenue, up 46.1% to ¥12,615 million, so gross profit grew only 32.8% to ¥2,915 million and the gross margin fell to 18.8% from 20.3%. The filing does not explain that decline. Selling, general and administrative expenses rose just 14.4% to ¥1,599 million, which is what lifted the operating margin to 8.5% from 7.4%.
Part of the profit gain is an accounting change. From this fiscal year the parent switched its property, plant and equipment (excluding lease assets) from mainly the declining-balance method to the straight-line method, citing a planned long-term programme of strategic capital spending and the wish to use one method across the group. The company states that this raised operating, ordinary and pre-tax profit by ¥153 million each (¥153,735 thousand) compared with the old method. Without it, operating profit would have been about ¥1,161 million — still up roughly 45.9%.
Below the operating line, subsidy income of ¥34 million helped offset interest expense of ¥66 million and a ¥20 million reduction-entry write-down of fixed assets. Total income taxes rose to ¥137 million, about 10.5% of pre-tax profit of ¥1,319 million, from ¥47 million; both years were reduced by deferred-tax benefits (¥113 million this year), and the higher charge is why net profit grew more slowly than operating profit.
Japan grew faster than the Philippines
The group runs a single precious-metal surface-treatment business and reports two regional segments: Japan, handled by the parent, and the Philippines, where Sanno Philippines Manufacturing Corporation (SPMC) serves Southeast Asia. Japan's sales to external customers rose 49.9% to ¥11,468 million and its segment profit 82.3% to ¥927 million; the whole ¥153 million depreciation benefit fell in this segment. The Philippines grew external sales 27.9% to ¥4,062 million and segment profit 49.8% to ¥364 million.
One customer, JAE Philippines Inc., booked in the Philippine segment, accounted for ¥2,922 million of sales against ¥2,245 million, about 18.8% of the consolidated total. On February 1, 2026 the parent absorbed a wholly owned subsidiary specialising in insert moulding of metal parts and resin, which removed it from the consolidation scope; the merger was accounted for as a transaction under common control.
An inventory build absorbs cash while debt is repaid
Total assets rose 7.3% to ¥13,785 million, mainly on an ¥841 million rise in raw materials and supplies and a ¥480 million rise in accounts receivable, partly offset by ¥499 million less cash and deposits. Liabilities fell ¥348 million to ¥5,747 million as short-term borrowings dropped ¥450 million and long-term borrowings ¥358 million. Net assets rose 19.0% to ¥8,038 million, taking the equity ratio to 58.3% from 52.6%.
Operating cash flow rose to ¥1,144 million from ¥461 million, as pre-tax profit of ¥1,319 million and depreciation of ¥492 million outweighed an ¥866 million increase in inventories. Investing cash flow was −¥693 million, including ¥610 million spent on property, plant and equipment, against +¥28 million a year earlier. Financing cash flow was −¥1,183 million, mostly a ¥450 million cut in short-term borrowings, ¥360 million of long-term loan repayments and ¥200 million of share buybacks. Cash and cash equivalents ended the year at ¥2,304 million, down from ¥2,938 million.
Flat sales and lower profit forecast; the doubled dividend is held
For FY7/2027 (August 1, 2026 – July 31, 2027) SANNO forecasts net sales of ¥15,600 million (+0.4%), operating profit of ¥800 million (−39.2%), ordinary profit of ¥815 million (−38.3%) and net profit of ¥676 million (−42.8%), or ¥159.36 per share. The company says the forecast builds in raw-material price fluctuations and a heavier depreciation burden from capital spending for the future, and assumes no disruption to global economic activity, to its own production or to its raw-material supply chain. It gives no further breakdown of the expected decline.
The annual dividend for FY7/2026 is ¥45.00 per share against ¥22.00, paid entirely at year-end, for a total of ¥190 million and a payout ratio of 16.4% (12.7% a year earlier); payment is scheduled to begin on October 30, 2026. For FY7/2027 the company plans to keep the dividend at ¥45.00, a payout ratio of 28.2% on the lower forecast profit.
| Metric | FY7/2026 | FY7/2025 | Change |
|---|---|---|---|
| Net sales (¥ million) | 15,531 | 10,830 | +43.4% |
| Gross profit (¥ million) | 2,915 | 2,194 | +32.8% |
| SG&A expenses (¥ million) | 1,599 | 1,398 | +14.4% |
| Operating profit (¥ million) | 1,315 | 796 | +65.2% |
| Operating margin | 8.5% | 7.4% | +1.1 pt |
| Ordinary profit (¥ million) | 1,319 | 806 | +63.6% |
| Net profit attrib. to owners of parent (¥ million) | 1,181 | 765 | +54.3% |
| EPS (¥) | 274.75 | 172.65 | +59.1% |
| Japan — revenue (¥ million) | 11,468 | 7,652 | +49.9% |
| Japan — segment profit (¥ million) | 927 | 508 | +82.3% |
| Philippines — revenue (¥ million) | 4,062 | 3,177 | +27.9% |
| Philippines — segment profit (¥ million) | 364 | 243 | +49.8% |
| Operating cash flow (¥ million) | 1,144 | 461 | +147.8% |
| Investing cash flow (¥ million) | −693 | 28 | n.m. |
| Financing cash flow (¥ million) | −1,183 | −35 | n.m. |
| Cash and cash equivalents at year-end (¥ million) | 2,304 | 2,938 | −21.6% |
| Total assets (¥ million) | 13,785 | 12,851 | +7.3% |
| Net assets (¥ million) | 8,038 | 6,755 | +19.0% |
| Equity ratio | 58.3% | 52.6% | +5.7 pt |
| FY7/2027 guidance — revenue (¥ million) | 15,600 | — | +0.4% |
| FY7/2027 guidance — operating profit (¥ million) | 800 | — | −39.2% |
| FY7/2027 guidance — ordinary profit (¥ million) | 815 | — | −38.3% |
| FY7/2027 guidance — net profit (¥ million) | 676 | — | −42.8% |
| FY7/2027 guidance — EPS (¥) | 159.36 | — | −42.0% |
| Annual dividend per share (¥) | 45.00 | 22.00 | +104.5% |
| FY7/2027 forecast — annual dividend per share | 45.00 | — | unchanged |
JapanStockPulse provides informational content only and does not constitute investment advice. Figures are taken from the company's published earnings short report and may be subject to subsequent revision.