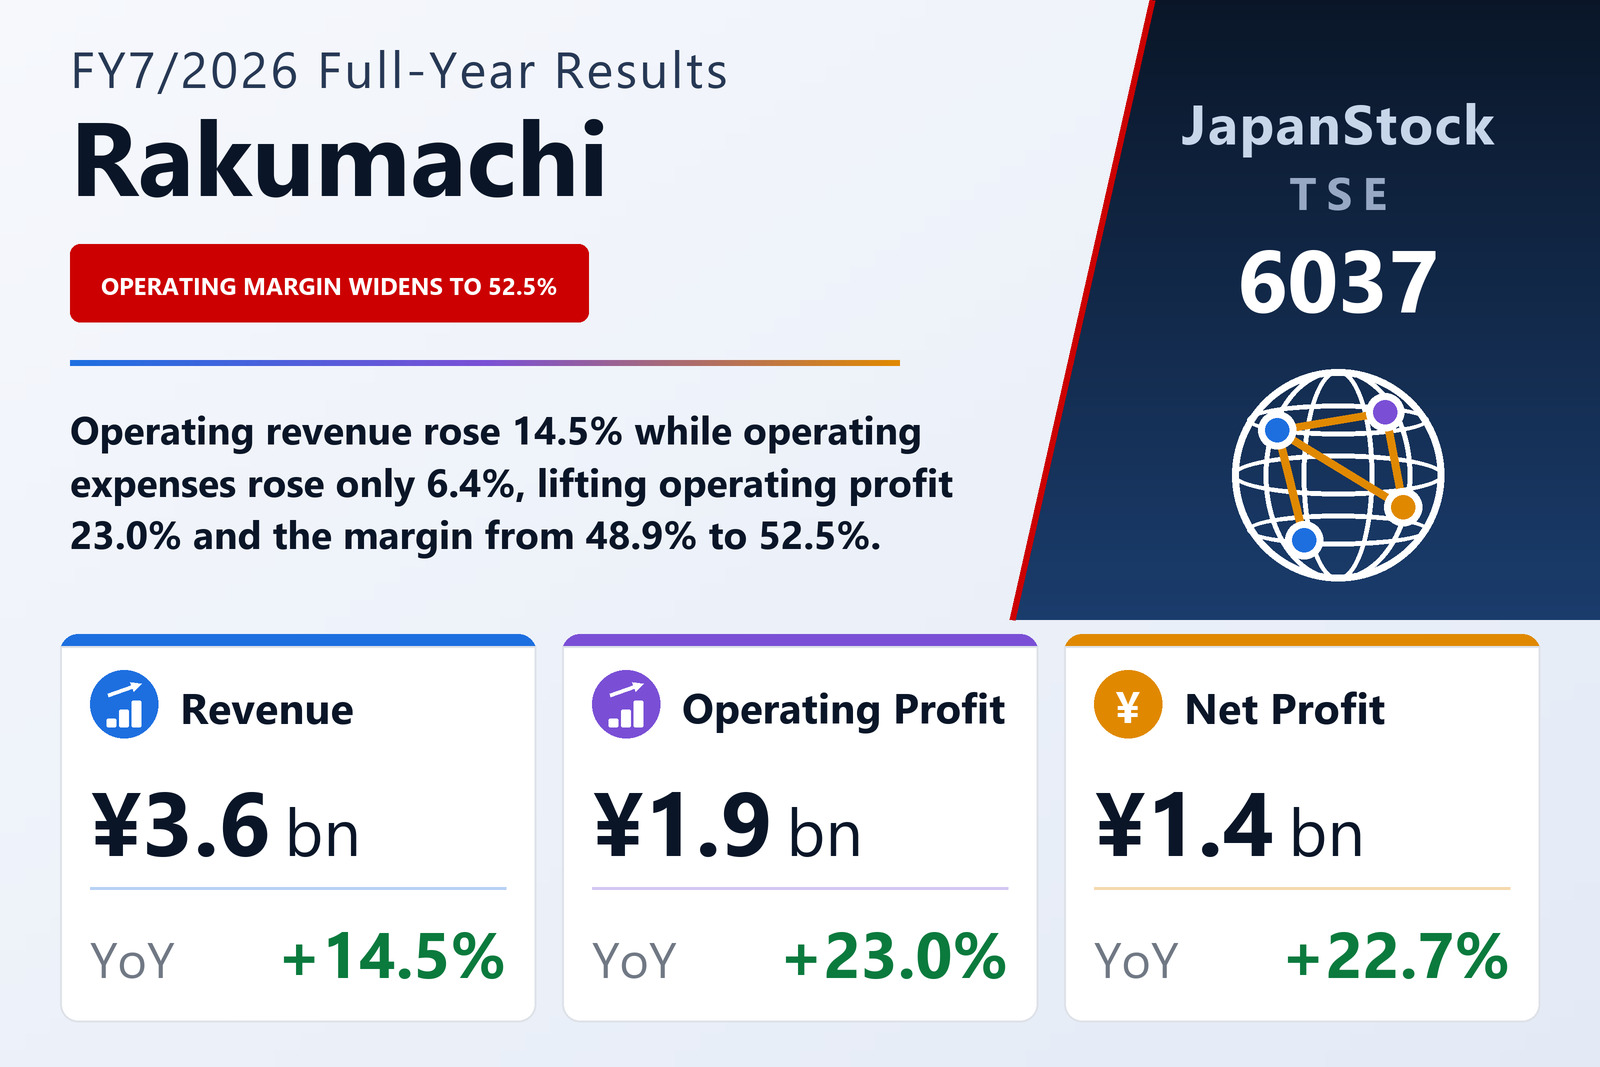
Revenue grew 14.5%, costs 6.4% — the margin did the rest
RAKUMACHI, INC. (TSE: 6037), the Tokyo-based operator of the Rakumachi real-estate-investment portal site, published non-consolidated results for the fiscal year from August 1, 2025 to July 31, 2026 on September 14, 2026 under Japanese GAAP. Operating revenue rose 14.5% to ¥3,617 million, operating profit 23.0% to ¥1,899 million, ordinary profit 21.9% to ¥2,132 million and net profit 22.7% to ¥1,436 million, for earnings of ¥73.43 per share against ¥56.09. The filing names the Tokyo Stock Exchange as the listing venue and reports a single segment, the real-estate-investment portal site business, so there is no segment breakdown.
The arithmetic is short because the income statement is. The company reports its costs as a single line of operating expenses, with no split into cost of sales and SG&A, and that line rose 6.4% to ¥1,718 million — less than half the pace of revenue. Of the roughly ¥458 million of added operating revenue, about ¥103 million went to higher expenses and about ¥355 million reached operating profit, which is why the operating margin widened from 48.9% to 52.5%. The filing does not break operating expenses down further or say which costs grew.
The filing attributes the year to content and sales effort around the portal. Through Rakumachi Shimbun and the Rakumachi Channel video channel the company expanded content for property investors to grow membership, and it strengthened sales to real-estate companies; it singles out a steady stream of videos on investment, politics and the economy and improvements to its official real-estate-investment app. Website membership reached 507 thousand, up 10.0%, and property listings 84 thousand, up 8.7%. As context the company cites a Dentsu survey showing Japan's internet advertising market grew 10.8% to ¥4.0459 trillion in calendar 2025, reaching 50.2% of total advertising spend — more than half for the first time.
Ordinary profit sits above operating profit because of a securities portfolio
Ordinary profit exceeded operating profit by about ¥233 million, and almost all of the gap is interest. Non-operating income was ¥239 million, of which ¥233 million was interest on securities, up from ¥212 million; the remainder was ¥1.4 million of interest received, a ¥2.0 million gain on the sale of securities and ¥2.2 million of miscellaneous income. Non-operating expenses fell to ¥6.1 million from ¥9.7 million. The source of the interest is on the balance sheet: investment securities of ¥4,269 million at July 31, 2026, up ¥184 million and equal to about 70% of total assets. Because non-operating income grew more slowly than operating profit, ordinary profit rose 21.9%, a little behind the operating line's 23.0%.
There were no extraordinary items, so pre-tax profit equalled ordinary profit at ¥2,132 million. Income taxes totalled ¥696 million, an effective rate of about 32.7% against 33.1% a year earlier, leaving net profit 22.7% higher at ¥1,436 million. Earnings per share grew faster, 30.9% to ¥73.43, because the average number of shares fell 6.3% to 19,558,912 as the company bought back stock. Return on equity was 27.4%, against 21.4%.
Cash went back to shareholders faster than the business generated it
Operating cash flow was ¥1,454 million, only 1.2% above last year's ¥1,436 million despite the higher profit, largely because income taxes paid rose to ¥727 million from ¥393 million. Investing activities used ¥260 million, almost all of it ¥260 million of purchases of property, plant and equipment. Financing activities used ¥1,676 million: ¥1,450 million of share buybacks, up from ¥1,131 million, and ¥228 million of dividends paid. Buybacks and dividends together came to about ¥1,678 million, some ¥224 million more than operating cash flow, and cash and cash equivalents fell ¥481 million to ¥709 million.
Total assets edged down 0.8% to ¥6,074 million from ¥6,122 million at July 31, 2025. Cash and deposits fell ¥436 million, deferred tax assets of ¥61 million fell to zero and current securities fell ¥49 million, while property, plant and equipment rose ¥268 million — buildings grew to ¥299 million from ¥33 million — investment securities rose ¥184 million and accounts receivable ¥57 million. On the other side the company newly booked a ¥59 million asset retirement obligation, and advances received rose ¥39 million; the filing does not say what the new building assets are. Net assets fell 2.0% to ¥5,196 million, because buybacks outweighed the year's net profit after dividends even though the valuation difference on available-for-sale securities rose ¥124 million, and the equity ratio slipped from 86.6% to 85.5%. The company cancelled 1,400,000 treasury shares during the year, reducing issued shares to 19,753,800, and held 842,442 treasury shares at the year-end.
Guidance: another 10.6%, with hiring and content costs built in
For FY7/2027 the company guides operating revenue of ¥4,000 million (+10.6%), operating profit of ¥2,100 million (+10.6%), ordinary profit of ¥2,324 million (+9.0%) and net profit of ¥1,520 million (+5.8%), for earnings per share of ¥80.37, about 9.5% above this year's ¥73.43. It expects revenue growth from its property listing and advertising services, and says planned operating expenses include higher personnel costs from recruitment and higher content production costs for Rakumachi Premium. Revenue and operating profit guided to grow at the same rate imply an operating margin of 52.5%, unchanged from this year, so the guidance does not assume a further widening. The filing gives no reason why ordinary and net profit are guided to grow more slowly than operating profit.
The outlook section lists rising long-term interest rates after policy-rate increases, US tariff policy and an unstable international situation as concerns, and the review of the year notes that the Bank of Japan raised its policy rate in December 2025 and June 2026. Against that the company expects the number of individuals considering real-estate investment as a way to build assets to keep rising, and plans to promote its Rakumachi Premium service and app and to expand content through the Rakumachi Shimbun email newsletter and the Rakumachi Channel.
Dividend up 30.0%, with a further rise to ¥16.00 planned
The annual dividend for FY7/2026 is ¥13.00, ¥6.50 at the half-year and ¥6.50 at the year-end, against ¥10.00 a year earlier — up 30.0%, for a total of ¥250 million and a payout ratio of 17.7%. The year-end dividend is scheduled to be paid from October 28, 2026, the day after the annual general meeting on October 27. For FY7/2027 the company forecasts ¥16.00, ¥8.00 at each half, a payout ratio of 19.9% on guided earnings. Even so, this year's shareholder returns leaned heavily toward buybacks: ¥1,450 million of stock repurchased against ¥228 million of dividends paid.
| Metric | FY7/2026 | FY7/2025 | Change |
|---|---|---|---|
| Operating revenue (¥ million) | 3,617 | 3,159 | +14.5% |
| Operating expenses (¥ million) | 1,718 | 1,614 | +6.4% |
| Operating profit (¥ million) | 1,899 | 1,544 | +23.0% |
| Operating margin | 52.5% | 48.9% | +3.6 pt |
| Ordinary profit (¥ million) | 2,132 | 1,749 | +21.9% |
| Net profit (¥ million) | 1,436 | 1,170 | +22.7% |
| EPS (¥) | 73.43 | 56.09 | +30.9% |
| Total assets (¥ million) | 6,074 | 6,122 | −0.8% |
| Net assets (¥ million) | 5,196 | 5,304 | −2.0% |
| Equity ratio | 85.5% | 86.6% | −1.1 pt |
| Operating cash flow (¥ million) | 1,454 | 1,436 | +1.2% |
| Share buybacks (¥ million) | 1,450 | 1,131 | +28.1% |
| Cash and equivalents at period end (¥ million) | 709 | 1,191 | −40.4% |
| FY7/2027 guidance — operating revenue (¥ million) | 4,000 | — | +10.6% |
| FY7/2027 guidance — operating profit (¥ million) | 2,100 | — | +10.6% |
| FY7/2027 guidance — ordinary profit (¥ million) | 2,324 | — | +9.0% |
| FY7/2027 guidance — net profit (¥ million) | 1,520 | — | +5.8% |
| FY7/2027 guidance — EPS (¥) | 80.37 | — | +9.5% |
| Annual dividend per share (¥) | 13.00 | 10.00 | +30.0% |
| FY7/2027 dividend forecast per share (¥) | 16.00 | 13.00 | +23.1% |
JapanStockPulse provides informational content only and does not constitute investment advice. Figures are taken from the company's published earnings short report and may be subject to subsequent revision.