Brokerage grew, but operating-lease deals slipped
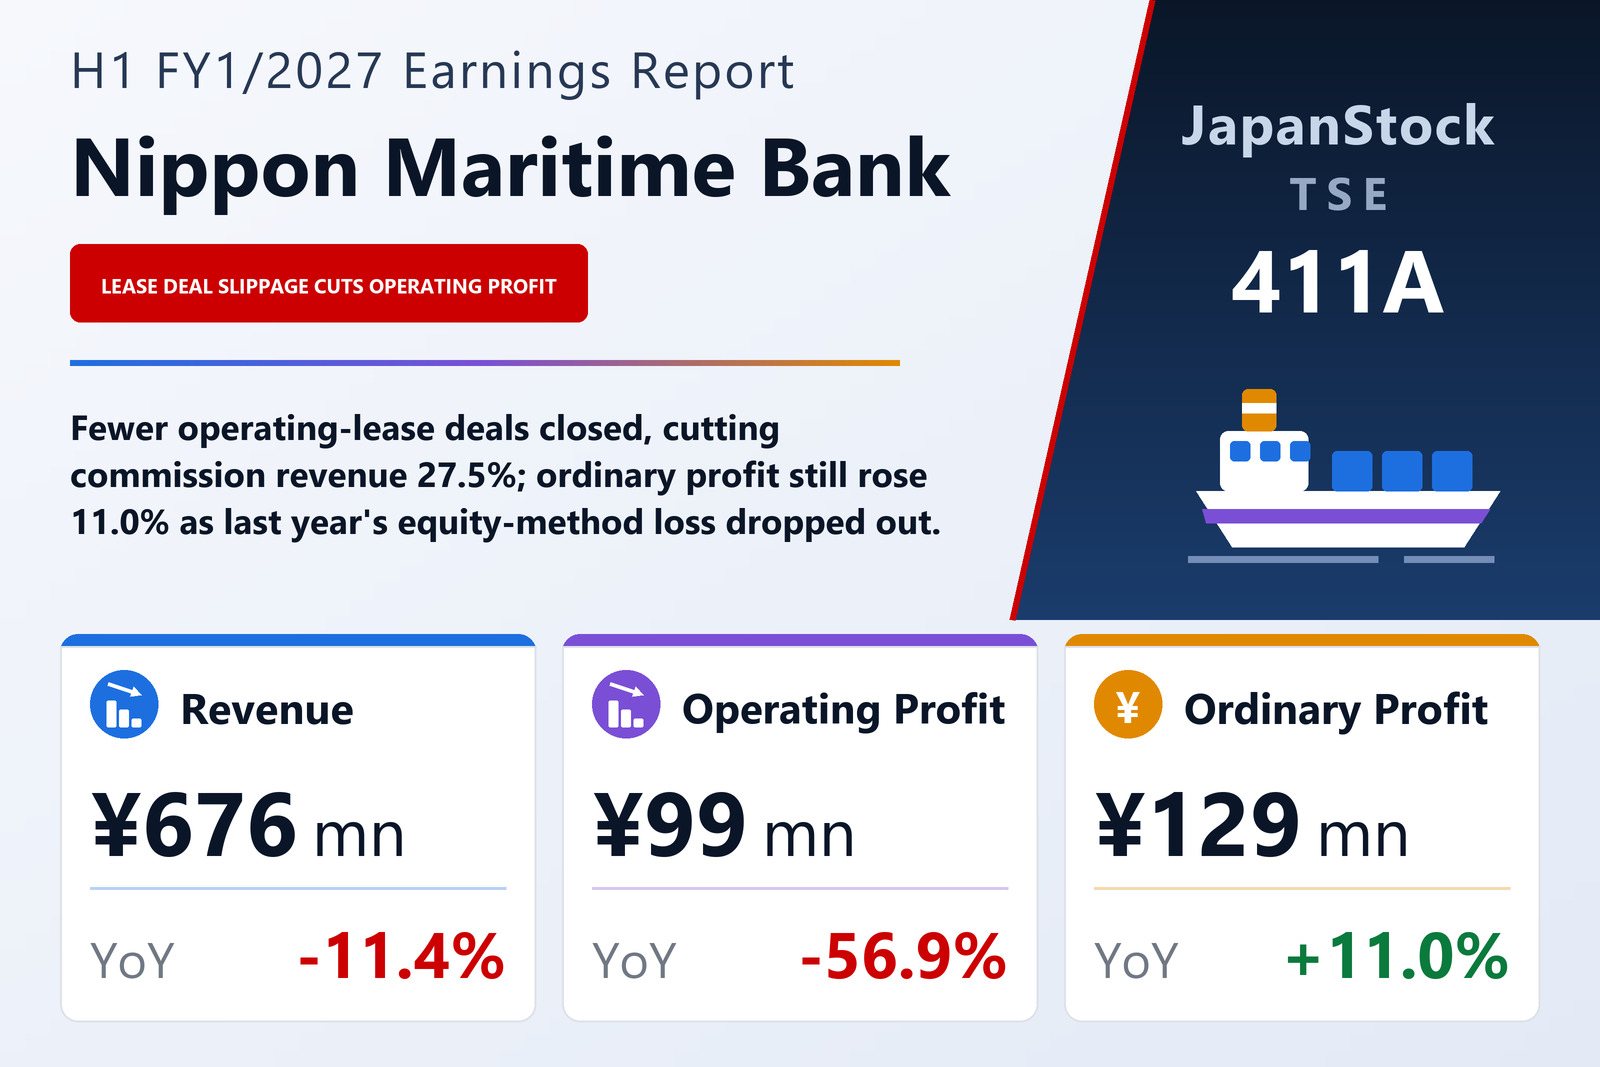
Nippon Maritime Bank Co., Ltd. (TSE: 411A), a group that provides financial services specialising in shipping — ship brokerage and operating-lease arrangement on one side, ship loans and finance leases held through subsidiaries on the other — published consolidated interim results for the six months from February 1 to July 31, 2026 on September 15, 2026, under Japanese GAAP. Its shares trade on the Tokyo Stock Exchange's TOKYO PRO Market, which is open only to professional investors. Revenue fell 11.4% to ¥676.2 million, operating profit 56.9% to ¥99.2 million, ordinary profit rose 11.0% to ¥129.7 million and profit attributable to owners of the parent fell 6.2% to ¥102.8 million, or ¥27.79 per share against ¥29.62 on 3,700,000 shares. The interim statements were not reviewed by an auditor, and the company plans to file its interim Issuer Information report on October 29, 2026.
The filing places the result in a crowded ship-finance market. Sale-and-leaseback deals by European financial institutions, Chinese leasing companies and Japanese shipowners have been active, it says, with ample money flowing into the most liquid vessels, so that ship and transaction prices for some vessel types and ages have stayed high and judging each deal's profitability and asset value has become more important. Against that, the group has been looking beyond liquid vessels to ship types and markets where funding is scarce. Financing those deals is harder, and the company says some took longer to put together — which is its explanation for the drop in revenue.
Cost of sales held flat; overheads rose by a fifth
Cost of sales was ¥311.0 million against ¥311.7 million, essentially unchanged, so almost the whole ¥86.7 million fall in revenue went straight through to gross profit, which dropped 19.1% to ¥365.2 million; the gross margin narrowed from 59.1% to 54.0%. Selling, general and administrative expenses rose in the opposite direction, 20.3% to ¥265.9 million, an increase of ¥44.8 million. Operating profit therefore fell by ¥130.8 million, about two thirds of it from lower gross profit and one third from higher overheads, and the operating margin halved from 30.1% to 14.7%. The filing does not break down the SG&A increase or say what caused it.
Why ordinary profit rose while operating profit halved
The explanation lies entirely below the operating line. A year earlier, non-operating expenses of ¥114.7 million — an equity-method investment loss of ¥75.1 million and a foreign-exchange loss of ¥39.6 million — had cut ordinary profit to ¥116.8 million. This half, non-operating income was ¥30.6 million, including a foreign-exchange gain of ¥25.1 million and interest income of ¥1.8 million, and non-operating expenses were just ¥93 thousand of interest. That swing of about ¥143.6 million more than offset the ¥130.8 million fall in operating profit and left ordinary profit ¥12.9 million higher, at ¥129.7 million. The filing attributes the rise to the equity-method loss dropping out and to the foreign-exchange gain.
The prior-year half had also carried a ¥47.4 million extraordinary gain on the sale of shares in an affiliate, with nothing comparable this time, so pre-tax profit fell 21.0% to ¥129.7 million from ¥164.2 million. What held the decline in net profit to 6.2% was tax: income taxes totalled ¥26.9 million against ¥54.6 million, as current taxes of ¥48.3 million were offset by a ¥21.4 million deferred-tax credit, bringing the effective rate to about 20.8% from 33.3%. The filing does not explain the deferred-tax credit. With no non-controlling interests, interim profit and profit attributable to owners were the same ¥102.8 million. Comprehensive income rose 24.5% to ¥112.3 million, helped by a ¥9.5 million foreign-currency translation gain against a ¥19.4 million loss a year earlier.
The commission business shrank; the asset business grew
In the Commission Business, revenue fell 27.5% to ¥284.7 million and segment profit 45.6% to ¥131.9 million. The filing says ship brokerage came in above the prior year, while the operating-lease service fell short because of the timing and number of deals closed. In the Asset Business, revenue rose 5.7% to ¥391.4 million but segment profit fell 18.0% to ¥45.7 million. The ship-loan service was affected by changes in the loan balance, according to the filing, while the finance-lease service run through subsidiaries grew on continuing revenue from existing deals; it gives no reason for the lower segment profit. The asset side now supplies 57.9% of revenue against 48.5%, a shift towards the recurring income base the company says it is building. Corporate costs not allocated to the two segments rose to ¥78.4 million from ¥68.0 million.
Collections on existing leases shrank the balance sheet and lifted cash
Total assets fell ¥329.5 million to ¥10,861.8 million from January 31, 2026. Lease receivables — ¥8,487.8 million, 78% of total assets — fell ¥706.6 million and operating loans ¥146.5 million to ¥818.3 million as existing ship loans and subsidiary finance leases were repaid, while cash and deposits rose ¥524.0 million to ¥1,353.5 million. Liabilities fell ¥441.8 million to ¥9,385.1 million: long-term borrowings including the current portion dropped ¥708.7 million to ¥8,063.1 million as loans tied to the subsidiary finance leases were paid down, partly offset by a ¥259.0 million rise in deposits received from silent-partnership (tokumei kumiai) investors, to ¥1,172.1 million. Net assets rose ¥112.3 million to ¥1,476.7 million on the half's profit and the translation gain, and the equity ratio improved from 12.2% to 13.6%. Long-term borrowings are still about 5.5 times net assets.
Cash flow shows the same turn. Operating activities generated ¥1,539.4 million, against an outflow of ¥4,985.4 million a year earlier, chiefly from a ¥1,021.8 million decrease in lease receivables, the ¥146.5 million fall in operating loans and the ¥259.0 million rise in silent-partnership deposits. Investing brought in ¥71.6 million, mainly ¥78.3 million of time deposits withdrawn. Financing used ¥1,013.5 million, almost all of it ¥1,008.5 million of long-term loan repayments. The prior-year half had run the other way: lease receivables grew by ¥5,214.1 million while ¥5,513.1 million of new long-term borrowing came in. Cash and cash equivalents rose ¥602.2 million to ¥1,353.5 million.
Guidance unchanged; a joint venture in India and a vessel purchase after the period
Full-year FY1/2027 guidance, first published on March 17, 2026, was left unchanged: revenue of ¥1,663 million (+10.0%), operating profit of ¥322 million (−7.6%), ordinary profit of ¥323 million (+15.9%) and net profit attributable to owners of ¥210 million (−2.1%), or ¥56.87 per share. The first half delivered 40.7% of guided revenue but only 30.8% of guided operating profit, leaving an implied second half of about ¥222.8 million of operating profit, more than twice the ¥99.2 million just booked; the filing does not say what it expects to drive that. No dividend was paid for FY1/2026, the interim dividend is nil and none is forecast for the year-end. Per-share figures reflect the 100-for-1 stock split of April 25, 2025, calculated as if it had taken place at the start of FY1/2026.
Two events after the period are disclosed. On August 18, 2026 the board resolved to set up a ship-leasing joint venture in GIFT City, the international financial services centre in Gujarat in western India, with Gaurav Sanjay Mehta, who held 350,000 shares, or 9.46%, of the company. Provisionally named Nippon Maritime Finance India IFSC Private Limited, it is to be 60% owned by the company and consolidated, with capital of 20 million rupees (about ¥34 million), incorporation planned for December 2026 and operations for January 2027, starting with ship operating leases. The filing notes that group companies under SPM Holdings Limited, 50% owned by Mr Mehta, have done finance-lease business with a consolidated subsidiary.
On September 15, 2026 the board also approved the purchase of the vessel AM PANTHER by NMB Shipping Ltd, a wholly owned subsidiary based in Monrovia, Liberia. The Marshall Islands-flagged platform supply vessel, built in 2014 and of 4,339 gross tons, is to be acquired for US$19,000,000 on October 20, 2026 and leased the same day to a charterer under a bareboat charter structured as a finance lease, with a purchase option during the term and an obligation on the charterer to buy the vessel at the end. It will be booked as a lease receivable rather than as a fixed asset. The purchase is to be funded with US$17,100,000 of bank borrowing, a ¥300 million junior loan from the parent and about US$100,000 of the subsidiary's own funds.
| Metric | H1 FY1/2027 | H1 FY1/2026 | Change |
|---|---|---|---|
| Revenue (¥ million) | 676 | 762 | −11.4% |
| Gross profit (¥ million) | 365 | 451 | −19.1% |
| Gross margin | 54.0% | 59.1% | −5.1 pt |
| SG&A expenses (¥ million) | 265 | 221 | +20.3% |
| Operating profit (¥ million) | 99 | 229 | −56.9% |
| Operating margin | 14.7% | 30.1% | −15.4 pt |
| Ordinary profit (¥ million) | 129 | 116 | +11.0% |
| Pre-tax profit (¥ million) | 129 | 164 | −21.0% |
| Net profit attrib. to owners of parent (¥ million) | 102 | 109 | −6.2% |
| Comprehensive income (¥ million) | 112 | 90 | +24.5% |
| EPS (¥) | 27.79 | 29.62 | −6.2% |
| Commission Business — revenue (¥ million) | 284 | 392 | −27.5% |
| Commission Business — segment profit (¥ million) | 131 | 242 | −45.6% |
| Asset Business — revenue (¥ million) | 391 | 370 | +5.7% |
| Asset Business — segment profit (¥ million) | 45 | 55 | −18.0% |
| Total assets (¥ million) | 10,861 | 11,191 | −2.9% |
| Lease receivables (¥ million) | 8,487 | 9,194 | −7.7% |
| Operating loans receivable (¥ million) | 818 | 964 | −15.2% |
| Long-term borrowings incl. current portion (¥ million) | 8,063 | 8,771 | −8.1% |
| Net assets (¥ million) | 1,476 | 1,364 | +8.2% |
| Equity ratio | 13.6% | 12.2% | +1.4 pt |
| Operating cash flow (¥ million) | 1,539 | −4,985 | n.m. |
| Financing cash flow (¥ million) | −1,013 | 5,083 | n.m. |
| FY1/2027 guidance — revenue (¥ million) | 1,663 | — | +10.0% |
| FY1/2027 guidance — operating profit (¥ million) | 322 | — | −7.6% |
| FY1/2027 guidance — ordinary profit (¥ million) | 323 | — | +15.9% |
| FY1/2027 guidance — net profit (¥ million) | 210 | — | −2.1% |
| FY1/2027 guidance — EPS (¥) | 56.87 | — | — |
| Annual dividend per share (¥) | 0.00 | 0.00 | unchanged |
JapanStockPulse provides informational content only and does not constitute investment advice. Figures are taken from the company's published earnings short report and may be subject to subsequent revision.