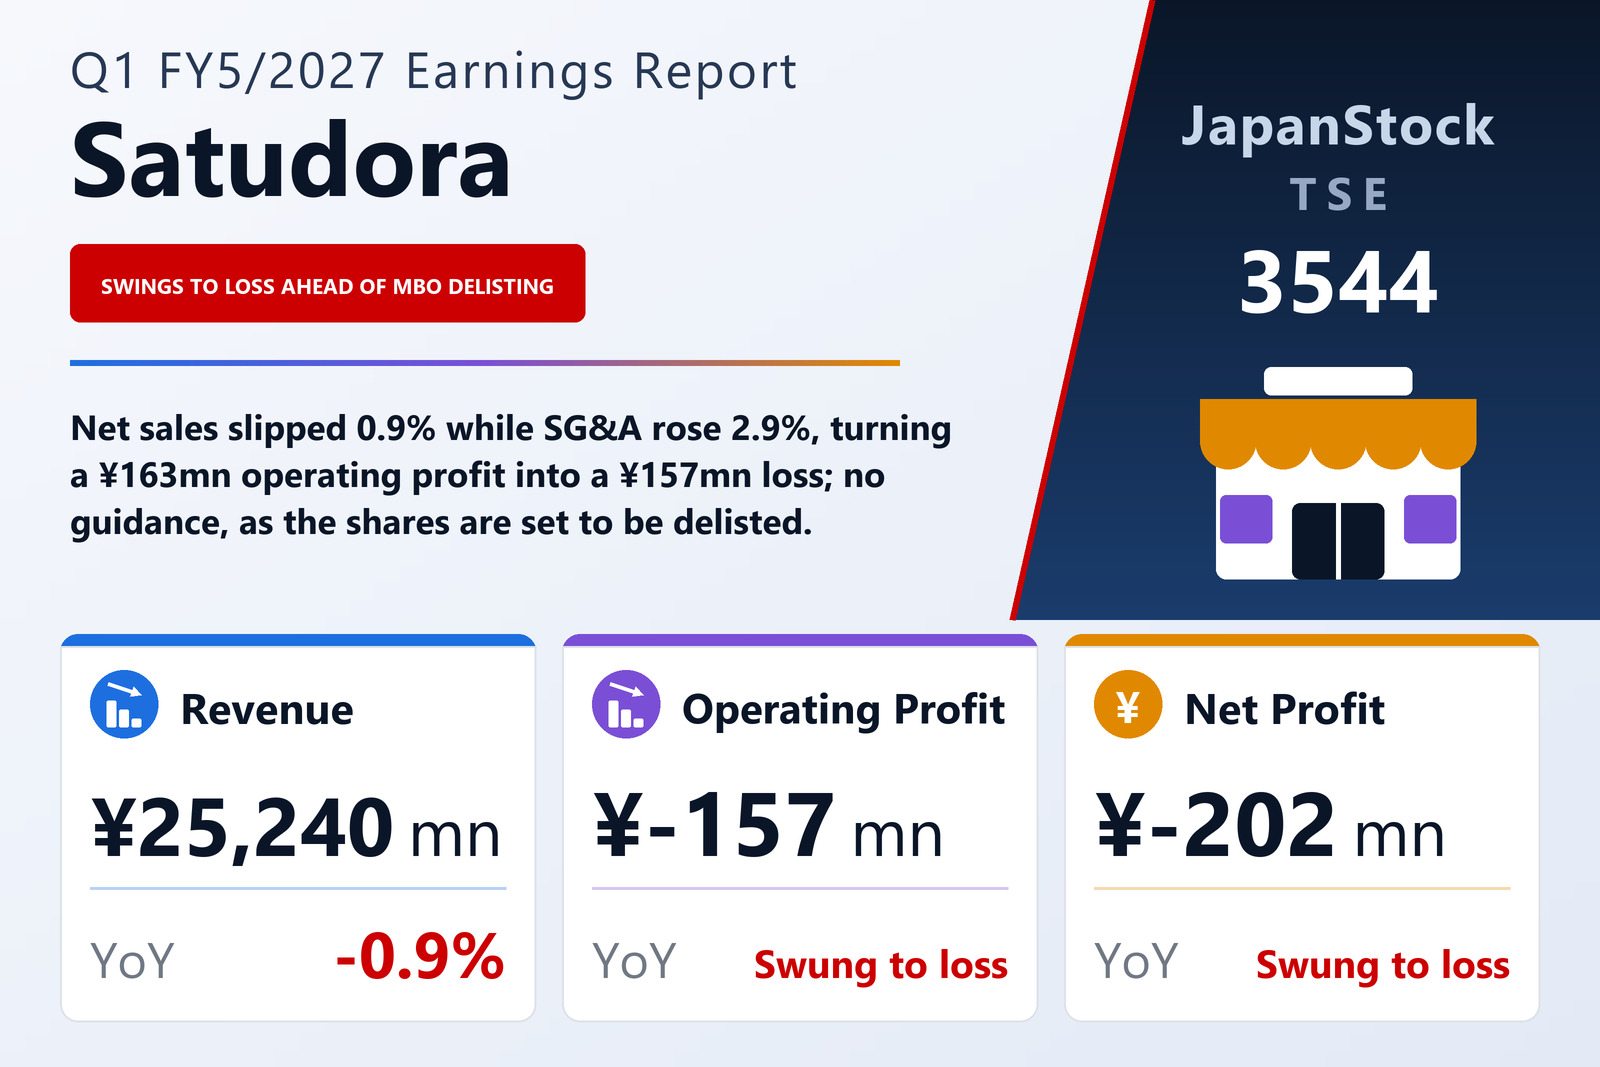
Net sales fell 0.9% and the quarter swung to an operating loss
Satudora Holdings Co., Ltd. (TSE: 3544), the group behind the Satudora drugstore and dispensing-pharmacy chain that operates mainly in Hokkaido, published consolidated first-quarter results for the three months from May 16 to August 15, 2026 on September 18, 2026 under Japanese GAAP. Net sales fell 0.9% to ¥25,240 million, a decline of ¥238 million. The group recorded an operating loss of ¥157 million against an operating profit of ¥163 million a year earlier, an ordinary loss of ¥176 million against a profit of ¥153 million, and a net loss attributable to owners of the parent of ¥202 million against a profit of ¥67 million — a loss of ¥14.66 per share against earnings of ¥4.92. The shares are listed on the Tokyo and Sapporo stock exchanges.
The swing from profit to loss is small in yen, and two lines explain all of it. Cost of sales fell 0.5% to ¥18,989 million, a little less than net sales, so gross profit fell 2.2% to ¥6,250 million — ¥141 million lower — and the gross margin eased from 25.1% to 24.8%. At the same time selling, general and administrative expenses rose 2.9% to ¥6,408 million, an increase of ¥181 million. Together the two movements account for the ¥320 million fall in operating profit, and the operating margin went from 0.6% to −0.6%. Depreciation and amortisation, disclosed in a note, rose to ¥391 million from ¥356 million.
Tender-offer costs and a securities write-down below the operating line
Non-operating items did little to change the picture. Non-operating income fell to ¥47 million from ¥58 million, mainly because subsidy income dropped to ¥1 million from ¥15 million, while interest expense edged up to ¥65 million from ¥63 million, leaving the ordinary loss at ¥176 million. The quarter then carried ¥145 million of extraordinary losses, against effectively none a year earlier, made up of a ¥75 million valuation loss on investment securities and ¥69 million of tender-offer-related expenses (the filing truncates each figure to whole millions). The pre-tax loss was ¥321 million. Income taxes were a credit of ¥116 million, leaving a net loss of ¥205 million, of which ¥3 million was attributable to non-controlling interests, so the loss attributable to owners of the parent was ¥202 million. Comprehensive income was a loss of ¥175 million against a profit of ¥62 million, softened by a ¥42 million valuation gain on other securities.
Drugstore and inbound sales shrank; dispensing grew
Retail, which carries almost all of the group's sales, recorded segment revenue of ¥24,723 million, down 1.3%, and a segment loss of ¥196 million against a profit of ¥109 million. Within it, drugstore-format sales to external customers fell 1.2% to ¥21,704 million. The company says beauty care held up, but both the number of items bought per customer and customer numbers declined as rising prices made shoppers more defensive and buying habits diversified, and summer merchandise sold poorly because of temperatures and the weather. Inbound-format stores, which serve overseas visitors at tourist destinations, fell 8.6% to ¥1,335 million despite campaigns aimed at those visitors; the company cites, among other things, the effect of China's call on its citizens to refrain from travel. Dispensing was the one growing line, up 3.3% to ¥1,313 million, helped in part by qualifying for a dispensing-fee premium tied to medical digital transformation. The company attributes the segment's swing to a loss to higher personnel costs, including base-pay increases, and to rising costs of its business-process reform.
The group closed three low-profitability stores during the quarter and opened none, taking the network from 196 to 193 stores: 174 drugstore-format stores, 22 of them with an in-store pharmacy, 10 inbound-format stores and 9 stand-alone dispensing pharmacies. The Marketing segment, built around the EZOCA common loyalty card for Hokkaido and payment services, grew revenue 8.2% to ¥539 million but posted a segment loss of ¥17 million against a profit of ¥2 million, which the company attributes mainly to revenue lost with the ending of its electronic-money service; it launched the EZO Pay smartphone payment service in September 2025. EZOCA membership has passed 2.4 million, with more than 350 partner companies and over 1,100 partner stores. Other businesses, which include POS applications, corporate venture capital and real estate, earned ¥10 million on revenue of ¥61 million, up 18.8%.
What management says it is doing
The filing describes the operating environment as difficult: drugstore chains are consolidating through M&A, larger rivals have more purchasing and hiring power, competition crosses industry lines and price rises are making consumers more thrifty. In response the company says it cut prices on 80 everyday items while trying to avoid unnecessary markdowns, launched a new private brand built around Hokkaido, introduced a company-wide collaboration tool to streamline internal processes and control costs, and is strengthening its relaunched official online store, which also carries goods from Hokkaido producers. The filing does not quantify the effect of any of these measures on the quarter.
A bank-holiday quarter-end inflated both sides of the balance sheet
Total assets rose 12.3% to ¥50,724 million from ¥45,153 million at May 15, 2026, but the company attributes this mainly to timing: the quarter-end fell on a bank holiday, so cash and deposits rose by ¥3,386 million to ¥4,869 million and accounts receivable by ¥1,355 million, while trade accounts payable rose by ¥5,339 million to ¥15,471 million. Total liabilities rose ¥5,746 million to ¥40,681 million, with other accounts payable up ¥802 million and long-term borrowings, including the current portion, down ¥418 million. Net assets fell ¥175 million to ¥10,043 million, chiefly because the quarter's loss reduced retained earnings by ¥202 million. With the balance sheet temporarily enlarged, the equity ratio dropped from 22.4% to 19.6%.
No guidance, because the shares are to be delisted
Satudora published no full-year forecast for FY5/2027. The filing explains that, as set out in its announcement of June 19, 2026 on the implementation of a management buyout and its recommendation that shareholders tender their shares, the tender offer for the company's shares was successful, and the shares are expected to be delisted once the prescribed subsequent procedures have been carried out. The ¥69 million of tender-offer-related expenses booked this quarter belong to that process. The company paid no dividend for FY5/2026, gives no dividend forecast for FY5/2027, and states that its most recently published dividend forecast has not been revised.
| Metric | Q1 FY5/2027 | Q1 FY5/2026 | Change |
|---|---|---|---|
| Net sales (¥ million) | 25,240 | 25,478 | −0.9% |
| Gross profit (¥ million) | 6,250 | 6,391 | −2.2% |
| Gross margin | 24.8% | 25.1% | −0.3 pt |
| SG&A expenses (¥ million) | 6,408 | 6,227 | +2.9% |
| Operating profit (¥ million) | −157 | 163 | profit to loss |
| Operating margin | −0.6% | 0.6% | −1.3 pt |
| Ordinary profit (¥ million) | −176 | 153 | profit to loss |
| Pre-tax profit (¥ million) | −321 | 152 | profit to loss |
| Net profit attrib. to owners of parent (¥ million) | −202 | 67 | profit to loss |
| Comprehensive income (¥ million) | −175 | 62 | profit to loss |
| EPS (¥) | −14.66 | 4.92 | profit to loss |
| Retail — revenue (¥ million) | 24,723 | 25,038 | −1.3% |
| Retail — segment profit (¥ million) | −196 | 109 | profit to loss |
| Marketing — revenue (¥ million) | 539 | 498 | +8.2% |
| Marketing — segment profit (¥ million) | −17 | 2 | profit to loss |
| Other — revenue (¥ million) | 61 | 51 | +18.8% |
| Other — segment profit (¥ million) | 10 | 10 | +3.9% |
| Total assets (¥ million) | 50,724 | 45,153 | +12.3% |
| Net assets (¥ million) | 10,043 | 10,218 | −1.7% |
| Cash and deposits (¥ million) | 4,869 | 1,483 | +228.3% |
| Accounts payable – trade (¥ million) | 15,471 | 10,131 | +52.7% |
| Equity ratio | 19.6% | 22.4% | −2.8 pt |
| Annual dividend per share (¥) | — | 0.00 | — |
JapanStockPulse provides informational content only and does not constitute investment advice. Figures are taken from the company's published earnings short report and may be subject to subsequent revision.