Revenue up 54%, and a loss turns into a profit
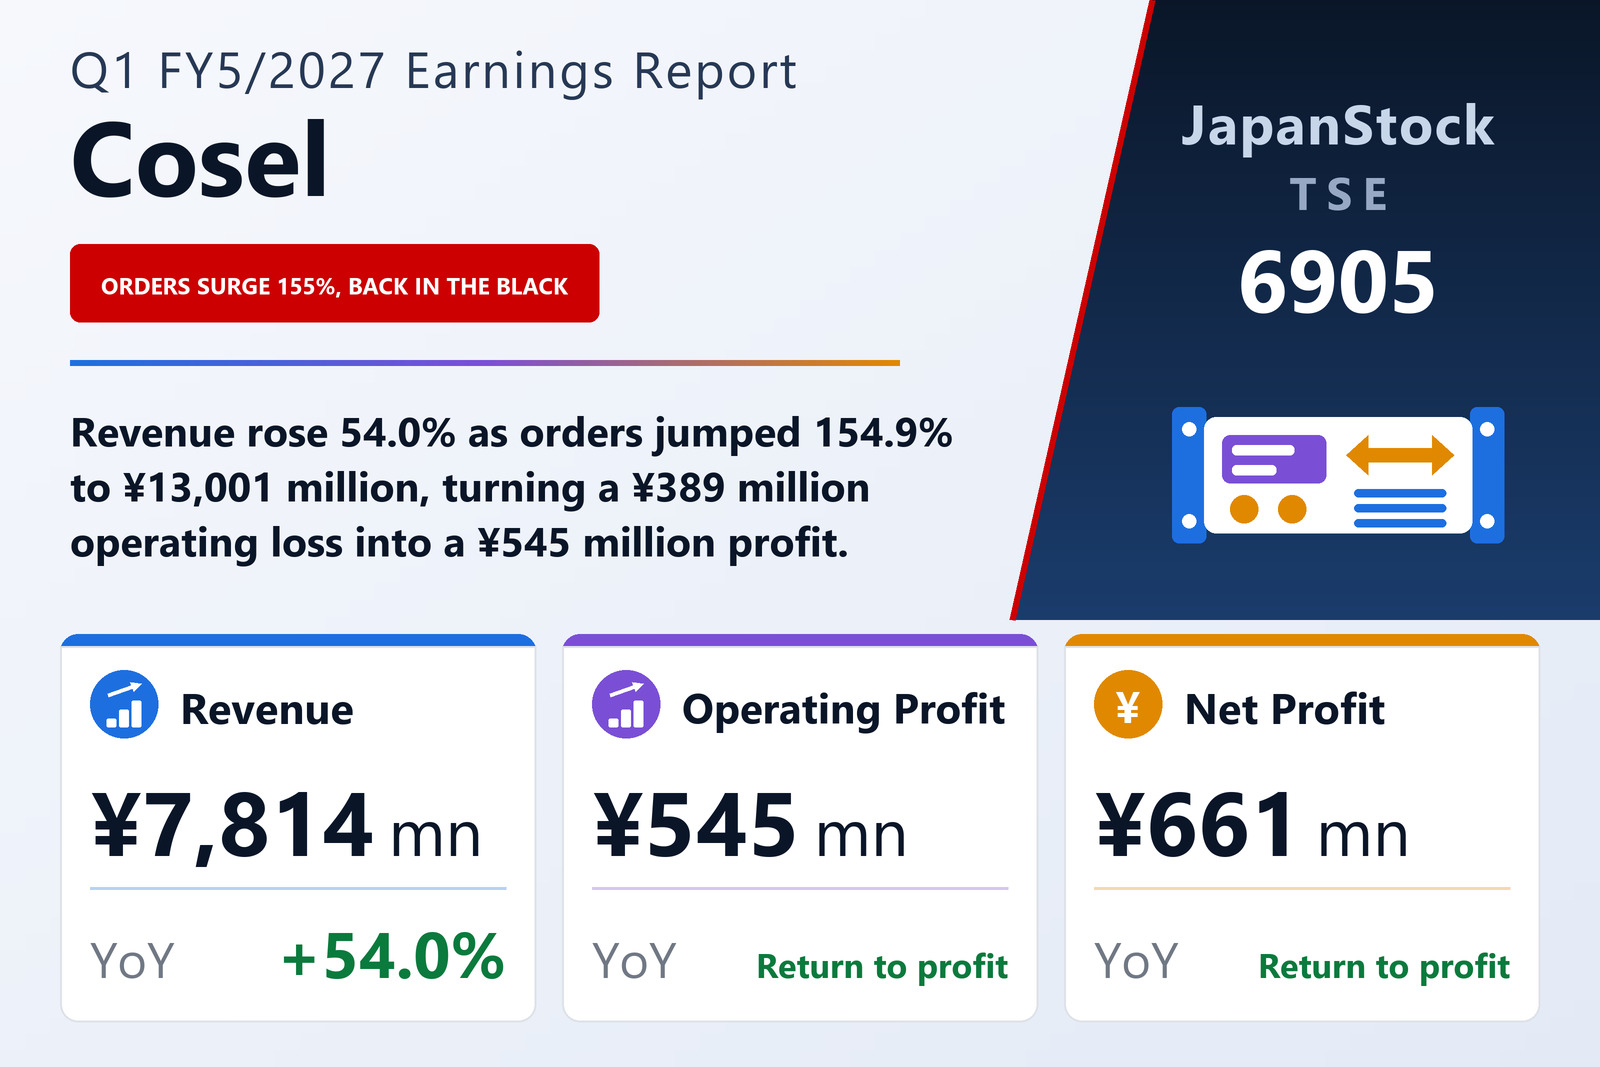
Cosel Co., Ltd. (TSE: 6905), the maker of unit and on-board power supplies and noise filters, published consolidated results for the first quarter of the fiscal year ending May 2027 — the three months from May 21 to August 20, 2026 — on September 18, 2026 under Japanese GAAP. Revenue rose 54.0% to ¥7,814 million from ¥5,075 million. Operating profit came to ¥545 million against an operating loss of ¥389 million a year earlier, ordinary profit to ¥580 million against a loss of ¥79 million, and profit attributable to owners of the parent to ¥661 million against a loss of ¥68 million. Earnings per share were ¥16.08, compared with a loss of ¥1.67 per share.
The filing puts the turnaround down to demand. Orders received rose 154.9% to ¥13,001 million, and the order backlog stood at ¥17,898 million on August 20, up 94.2% on a year earlier. The company points to continued growth in semiconductor demand for servers and data centres as AI drives the digitalisation of society, and to a recovery in automotive and industrial-equipment markets. On its own side it cites customer visits, closer coordination between its sales and development teams, and proposals built around new products; products under the new COSELSYNC. brand and LITEON products, sold through its partnership with LITE-ON TECHNOLOGY CORPORATION, have begun to contribute gradually to sales.
Gross margin widens by 4.2 points while SG&A rises 5.5%
Cost of sales rose 45.3% to ¥5,489 million, more slowly than revenue, so gross profit climbed 79.2% to ¥2,324 million and the gross margin widened from 25.6% to 29.7%. Selling, general and administrative expenses rose only 5.5% to ¥1,779 million. The filing acknowledges higher material prices and increased personnel and other expenses, but says the recovery in revenue brought a substantial improvement in profitability. The operating margin was 7.0%, against minus 7.7% a year earlier.
Below the operating line the comparison ran the other way. Non-operating income fell to ¥70 million from ¥312 million, a figure that had included a foreign-exchange gain of ¥198 million and compensation received of ¥53 million; this quarter carried a foreign-exchange loss of ¥34 million instead, leaving ordinary profit at ¥580 million. An extraordinary gain of ¥355 million on the liquidation of affiliates, which the filing links to the transfer of its shares in consolidated subsidiary Powerbox International AB, lifted pre-tax profit to ¥929 million. After income taxes of ¥267 million, net profit was ¥661 million. Comprehensive income rose 63.1% to ¥824 million.
Unit power supplies lead; Japan swings to a segment profit
By product, sales of unit power supplies rose 77.7% to ¥4,307 million, on-board power supplies 47.6% to ¥1,819 million and noise filters 77.9% to ¥460 million, while PRBX products — the range developed, made and sold by Powerbox International AB — grew 5.7% to ¥1,226 million. Orders for unit power supplies rose 219.2% to ¥7,357 million.
In Japan Production & Sales, sales to external customers rose 81.3% to ¥4,806 million and the segment earned ¥535 million against a loss of ¥291 million. The filing describes rapidly rising demand related to semiconductor manufacturing equipment, while noting supply concerns for memory and printed circuit boards that make the outlook less clear. North America Sales grew 81.5% to ¥569 million, helped by large orders, and swung to a profit of ¥80 million from a loss of ¥15 million. Asia Sales rose 56.4% to ¥922 million as customers worked through their inventories and large projects contributed; its profit rose 246.8% to ¥61 million.
Europe Production & Sales was the exception. The filing says demand there has been in an adjustment phase since the previous fiscal year and customers continued to adjust orders; external sales slipped 0.3% to ¥1,515 million and the segment loss widened to ¥207 million from ¥184 million. China Production, which sells only within the group, raised its intersegment sales 130.2% to ¥876 million as output increased, and earned ¥73 million against a loss of ¥13 million.
Cash falls after the dividend; equity ratio at 84%
Total assets rose to ¥61,704 million on August 20 from ¥60,576 million at the May 20 year-end. Cash and deposits fell by ¥1,761 million to ¥26,609 million, while trade receivables and inventories increased and property, plant and equipment grew by ¥1,196 million, mainly buildings and structures. Net assets eased to ¥51,836 million, as net profit of ¥661 million was more than offset by dividends of ¥1,151 million. The equity ratio was 84.0%, down from 86.1%. The company did not prepare a quarterly cash-flow statement; depreciation for the quarter was ¥312 million.
Forecasts revised as Powerbox leaves the group
Cosel revised its first-half and full-year forecasts the same day, citing first-quarter progress and the economic and market outlook. It now expects first-half revenue of ¥15,380 million (+38.1%) and operating profit of ¥970 million, and for the full year revenue of ¥31,800 million (+27.0%), operating profit of ¥2,300 million, ordinary profit of ¥2,400 million and net profit of ¥2,600 million, or ¥63.21 per share. The first quarter delivered 24.6% of the full-year revenue forecast and 23.7% of the operating profit forecast. The dividend forecast is unchanged at ¥60.00 per share for the year (¥30.00 at the interim and ¥30.00 at year-end), against ¥55.00 for the previous year.
The sale of all shares in Powerbox International AB, agreed on May 20, 2026, was completed on September 1, 2026. Cosel expects to book a further gain on the liquidation of affiliates as extraordinary income in the second quarter — an amount that may change with the final adjustment of the transfer price — and says the impact currently expected is built into the revised forecasts. Powerbox International AB and its subsidiaries are to be removed from the scope of consolidation from the second quarter.
| Metric | Q1 FY5/2027 | Q1 FY5/2026 | Change |
|---|---|---|---|
| Revenue (¥ million) | 7,814 | 5,075 | +54.0% |
| Gross profit (¥ million) | 2,324 | 1,297 | +79.2% |
| Gross margin | 29.7% | 25.6% | +4.2 pt |
| SG&A expenses (¥ million) | 1,779 | 1,687 | +5.5% |
| Operating profit (¥ million) | 545 | −389 | loss to profit |
| Operating margin | 7.0% | −7.7% | +14.6 pt |
| Ordinary profit (¥ million) | 580 | −79 | loss to profit |
| Pre-tax profit (¥ million) | 929 | −79 | loss to profit |
| Net profit attrib. to owners of parent (¥ million) | 661 | −68 | loss to profit |
| Comprehensive income (¥ million) | 824 | 505 | +63.1% |
| EPS (¥) | 16.08 | −1.67 | loss to profit |
| Orders received (¥ million) | 13,001 | — | +154.9% |
| Order backlog (¥ million) | 17,898 | — | +94.2% |
| Japan Production & Sales — revenue (¥ million) | 4,806 | 2,651 | +81.3% |
| Japan Production & Sales — segment profit (¥ million) | 535 | −291 | loss to profit |
| North America Sales — revenue (¥ million) | 569 | 313 | +81.5% |
| North America Sales — segment profit (¥ million) | 80 | −15 | loss to profit |
| Europe Production & Sales — revenue (¥ million) | 1,515 | 1,520 | −0.3% |
| Europe Production & Sales — segment profit (¥ million) | −207 | −184 | loss widened |
| Asia Sales — revenue (¥ million) | 922 | 589 | +56.4% |
| Asia Sales — segment profit (¥ million) | 61 | 17 | +246.8% |
| China Production — intersegment sales (¥ million) | 876 | 380 | +130.2% |
| China Production — segment profit (¥ million) | 73 | −13 | loss to profit |
| Total assets (¥ million) | 61,704 | 60,576 | +1.9% |
| Net assets (¥ million) | 51,836 | 52,163 | −0.6% |
| Cash and deposits (¥ million) | 26,609 | 28,370 | −6.2% |
| Equity ratio | 84.0% | 86.1% | −2.1 pt |
| FY5/2027 guidance — revenue (¥ million) | 31,800 | — | +27.0% |
| FY5/2027 guidance — operating profit (¥ million) | 2,300 | — | n.m. |
| FY5/2027 guidance — ordinary profit (¥ million) | 2,400 | — | +798.1% |
| FY5/2027 guidance — net profit (¥ million) | 2,600 | — | n.m. |
| FY5/2027 guidance — EPS (¥) | 63.21 | — | — |
| Annual dividend per share (¥) | 60.00 | 55.00 | +9.1% |
JapanStockPulse provides informational content only and does not constitute investment advice. Figures are taken from the company's published earnings short report and may be subject to subsequent revision.