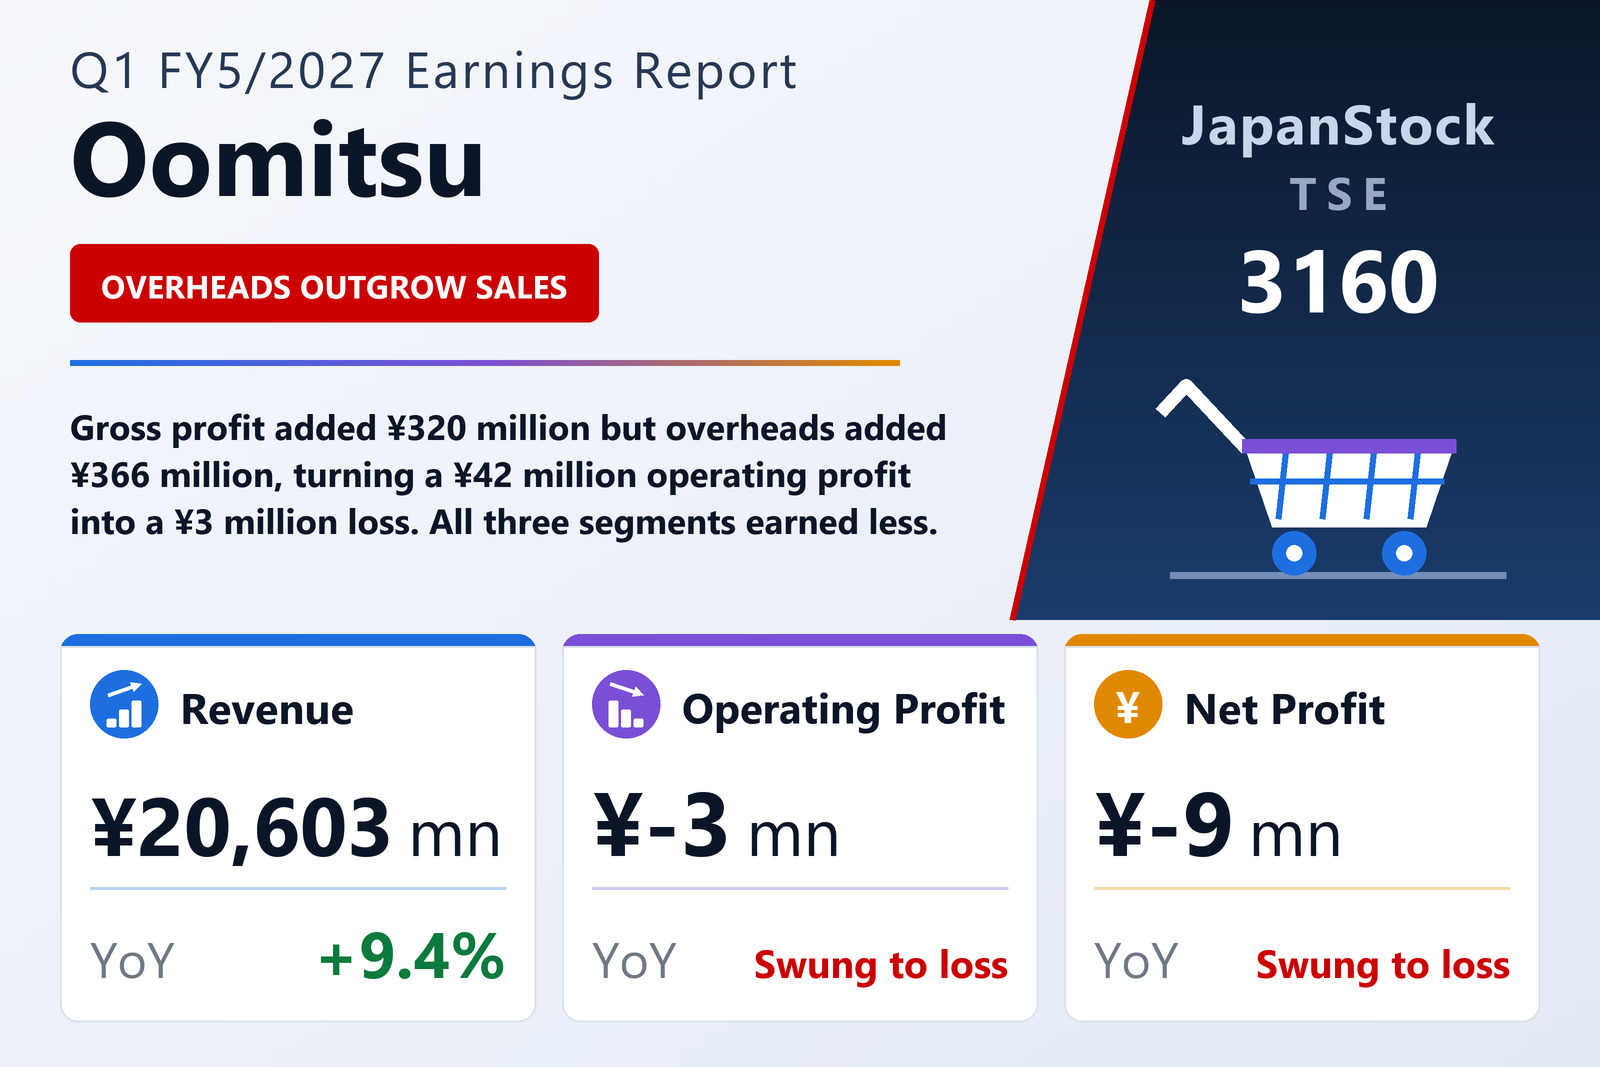
Revenue grew 9.4%, SG&A grew 10.3% — and the gap between them is the whole result
Oomitsu Co., Ltd. (TSE: 3160), the Ogaki, Gifu Prefecture wholesaler of commercial foodservice products that also operates the Amica cash-and-carry store chain, published consolidated first-quarter results for the three months from June 1 to August 31, 2026 on September 24, 2026 under Japanese GAAP. Revenue rose 9.4% to ¥20,603 million, but the quarter produced an operating loss of ¥3 million against a ¥42 million operating profit a year earlier, ordinary profit fell 71.3% to ¥9 million, and the bottom line was a net loss attributable to owners of the parent of ¥9 million against a ¥4 million profit, or −¥0.66 per share against ¥0.34. The shares are listed on the Standard market of the Tokyo Stock Exchange.
The swing is a cost story, and the two lines that carry it sit barely a percentage point apart. Cost of sales rose 9.6% to ¥16,678 million, marginally faster than revenue, so gross profit grew 8.9% to ¥3,925 million and the gross margin slipped from 19.2% to 19.1%. Selling, general and administrative expenses, however, rose 10.3% to ¥3,929 million. In money rather than percentages, gross profit added ¥319.7 million year on year while SG&A added ¥366.1 million, and the ¥46.4 million difference between those two increments is the entire distance from last year's ¥42 million operating profit to this year's ¥3 million operating loss. Put plainly, Oomitsu's quarterly overhead bill of ¥3,929 million was larger than the ¥3,925 million of gross profit available to cover it.
Non-operating income kept the ordinary line positive; tax pushed the bottom line negative
Ordinary profit of ¥9 million sits above the operating loss rather than below it, which is unusual enough to take apart. Non-operating income rose to ¥61 million from ¥48 million while non-operating expenses fell to ¥48 million from ¥59 million, so the net non-operating contribution moved from minus ¥10.7 million to plus ¥12.7 million — a ¥23.5 million improvement that recovered roughly half of the ¥46.4 million lost at the operating line. Two items drive it: other non-operating income rose from ¥4.5 million to ¥20.1 million, and other non-operating expenses fell from ¥17.9 million to ¥1.8 million. Working the other way, interest expense rose 58.7%, from ¥21.2 million to ¥33.6 million, even though total borrowings fell over the quarter. The filing itemises all of these and explains none of them.
There were no extraordinary gains or losses at all, so pre-tax quarterly profit was also ¥9.1 million. Income taxes then came to ¥18.6 million — ¥9.6 million of current tax and ¥8.9 million of deferred tax — more than twice the pre-tax result, and that is what turns a positive pre-tax figure into a ¥9.4 million net loss. The same three lines read ¥31.9 million, ¥27.0 million and ¥4.9 million a year earlier, so tax was already absorbing most of the result before this quarter's operating deterioration; on a pre-tax base this small, the tax charge decides the sign of the bottom line. Comprehensive income was minus ¥8 million against ¥43 million.
Every segment earned less, and revenue moved toward the thinnest-margin one
All three reportable segments reported lower profit. Foodservice Wholesale, the commercial-food distribution business, grew revenue 14.8% to ¥14,236 million but saw segment profit slip 2.5% to ¥99 million. Amica, the cash-and-carry retail chain, grew revenue just 1.2% to ¥5,782 million while segment profit fell 26.3% to ¥145 million. Marine Products, run through the consolidated subsidiary Marine Delica Co., Ltd., shrank 15.2% to ¥624 million with segment profit down 69.3%, from ¥5.1 million to ¥1.5 million. These segment figures include intersegment sales of ¥43 million, which is why they total ¥20,642 million against group revenue of ¥20,603 million.
The mix arithmetic underneath is the clearest account of the group result the filing allows. Foodservice Wholesale earns a segment margin of about 0.7% and Amica about 2.5% — and wholesale grew 14.8% while Amica grew 1.2%, so wholesale's share of segment revenue rose from 65.8% to 69.0% in a single year. Growth arrived overwhelmingly in the business that converts least of it into profit. Each segment's own margin narrowed as well: wholesale from 0.8% to 0.7%, Amica from 3.4% to 2.5% and marine products from 0.7% to 0.3%. Combined reportable-segment profit fell 19.0%, to ¥246.6 million from ¥304.4 million; corporate overhead carried in the adjustment line eased from minus ¥265.2 million to minus ¥253.2 million, absorbing ¥12.0 million of that fall, and the unreported Other category — a solar-power generation business — contributed ¥2.9 million against ¥3.5 million.
On causes the filing is descriptive rather than explanatory. In wholesale it says it deepened existing accounts and opened new ones across school and hospital catering and prepared-meal channels, leaning on labour-saving products and private-brand lines aimed at customers' own staffing and cost problems, while cutting personnel and distribution costs. At Amica it widened assortments, ran maker fairs, stepped up social-media and app promotion and added items suited to household consumption, and opened one new store — Gujo Hachiman in Gifu Prefecture — in June 2026, taking the chain to 55 stores concentrated in Aichi and Gifu at quarter-end. In marine products it pursued export sales and new customers through Marine Delica. What the filing does not do is say why, with all of that in place, profit fell in all three. Its description of the market is the nearest thing to a reason: its foodservice customers are recovering on inbound tourism demand, but raw-material and logistics costs keep rising and the labour shortage is chronic.
A smaller balance sheet, and ¥617 million less debt
Total assets fell 1.9% to ¥28,348 million from ¥28,903 million at May 31, 2026. Within current assets, cash and deposits rose ¥652 million to ¥1,368 million while notes and accounts receivable fell ¥1,144 million to ¥7,385 million, a net decline of ¥727 million; non-current assets rose ¥172 million, with buildings and structures up ¥45 million. Total liabilities fell ¥439 million to ¥22,222 million: short-term borrowings down ¥229 million to ¥4,390 million and long-term borrowings down ¥338 million to ¥4,387 million, partly offset by accounts payable up ¥315 million. Counting the ¥1,435 million current portion of long-term debt, total interest-bearing borrowings fell from ¥10,830 million to ¥10,212 million. Net assets fell 1.8% to ¥6,126 million, almost entirely because retained earnings dropped ¥116 million — the quarter's ¥9 million loss plus an implied ¥107 million of dividends, being the prior year's ¥7.50 year-end payment on 14,276,588 shares. Assets and equity fell at almost the same rate, so the equity ratio was unchanged at 21.6%.
A loan covenant written on the ordinary line, not the operating one
A supplementary note discloses financial covenants attached to a syndicated loan with a quarter-end balance of ¥2,083 million. Net assets on both the consolidated and the non-consolidated balance sheet must stay at or above 75% of their level at the May 2023 fiscal year-end, and consolidated and non-consolidated ordinary profit must not be a loss in two consecutive fiscal years. The company states it was not in breach of either at August 31, 2026. Which line the second covenant is written on matters here: the quarter's operating result was a loss, but the ordinary line — the one the covenant tests — stayed positive at ¥9 million, and the test is applied at fiscal year-ends rather than quarterly.
Guidance and dividend untouched — the remaining nine months now carry all of it
Oomitsu made no change to the full-year FY5/2027 forecast it published on July 14, 2026: revenue of ¥85,600 million (+7.6%), operating profit of ¥630 million (+295.2%), ordinary profit of ¥630 million (+85.7%) and net profit attributable to owners of ¥400 million (+603.6%), for earnings of ¥28.02 per share. The half-year forecast is revenue of ¥41,200 million (+8.8%), operating profit of ¥20 million, ordinary profit of ¥20 million (−82.9%) and net profit of ¥5 million (−94.6%).
Read against the quarter just delivered, that guidance is ordinary at the top line and demanding below it. Revenue of ¥20,603 million is 24.1% of the full-year figure, about what a first quarter should be. Operating profit, though, is minus ¥3 million against a guided ¥630 million, so the remaining nine months must produce ¥633 million, and the second quarter alone has to contribute ¥23 million merely to reach the ¥20 million half-year figure. The filing gives no account of what changes. The dividend forecast was also left alone at ¥7.50 at the interim and ¥7.50 at the year-end, for ¥15.00, the same as FY5/2026 and about 54% of guided earnings per share; no first-quarter dividend was declared and no payment start date was set.
| Metric | Q1 FY5/2027 | Q1 FY5/2026 | Change |
|---|---|---|---|
| Revenue (¥ million) | 20,603 | 18,825 | +9.4% |
| Gross profit (¥ million) | 3,925 | 3,605 | +8.9% |
| Gross margin | 19.1% | 19.2% | −0.1 pt |
| SG&A expenses (¥ million) | 3,929 | 3,562 | +10.3% |
| Operating profit (¥ million) | −3 | 42 | profit to loss |
| Ordinary profit (¥ million) | 9 | 31 | −71.3% |
| Net profit attrib. to owners of parent (¥ million) | −9 | 4 | profit to loss |
| EPS (¥) | −0.66 | 0.34 | profit to loss |
| Comprehensive income (¥ million) | −8 | 43 | profit to loss |
| Foodservice Wholesale — revenue (¥ million) | 14,236 | 12,401 | +14.8% |
| Foodservice Wholesale — segment profit (¥ million) | 99 | 102 | −2.5% |
| Amica Retail — revenue (¥ million) | 5,782 | 5,714 | +1.2% |
| Amica Retail — segment profit (¥ million) | 145 | 196 | −26.3% |
| Marine Products — revenue (¥ million) | 624 | 735 | −15.2% |
| Marine Products — segment profit (¥ million) | 1 | 5 | −69.3% |
| Total assets (¥ million) | 28,348 | 28,903 | −1.9% |
| Net assets (¥ million) | 6,126 | 6,241 | −1.8% |
| Equity ratio | 21.6% | 21.6% | unchanged |
| FY5/2027 guidance — revenue (¥ million) | 85,600 | — | +7.6% |
| FY5/2027 guidance — operating profit (¥ million) | 630 | — | +295.2% |
| FY5/2027 guidance — ordinary profit (¥ million) | 630 | — | +85.7% |
| FY5/2027 guidance — net profit (¥ million) | 400 | — | +603.6% |
| Annual dividend per share (¥) | 15.00 | 15.00 | unchanged |
JapanStockPulse provides informational content only and does not constitute investment advice. Figures are taken from the company's published earnings short report and may be subject to subsequent revision.