Revenue grew 2.3%, cost of sales 0.8% — and that gap is the result
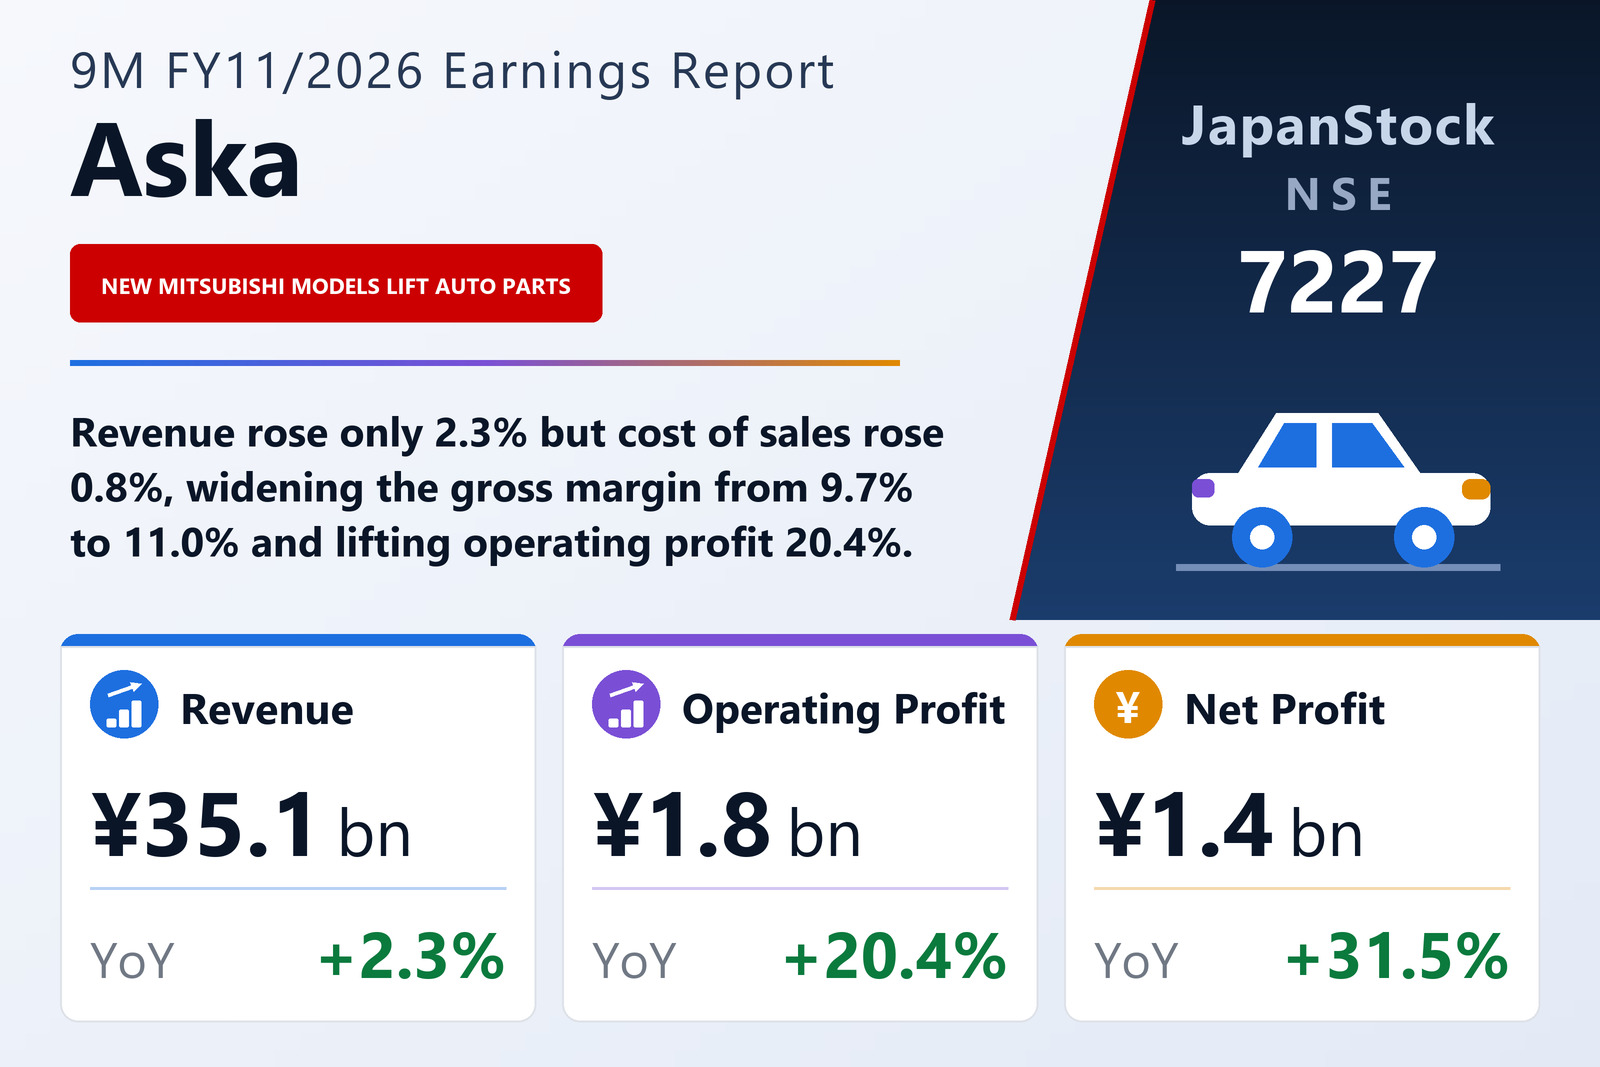
Aska Corporation (NSE: 7227), the Kariya, Aichi-based group whose five businesses run from automotive parts and press dies through factory control and robot systems to motorsport events and property leasing and solar power, published consolidated results for the first nine months of FY11/2026, the period from December 1, 2025 to August 31, 2026, on September 24, 2026 under Japanese GAAP. Revenue rose 2.3% to ¥35,061 million, operating profit 20.4% to ¥1,757 million, ordinary profit 27.8% to ¥1,945 million and profit attributable to owners of the parent 31.5% to ¥1,373 million, for earnings of ¥240.62 per share against ¥182.92. The shares are listed on the main market of the Nagoya Stock Exchange.
Almost none of that came from selling more. Revenue grew by ¥789 million, or 2.3%, while cost of sales rose only 0.8% to ¥31,196 million — an increase of ¥242 million on a cost base above ¥31,000 million. Gross profit therefore rose 16.5% to ¥3,864 million, seven times the rate of revenue, and the gross margin widened from 9.7% to 11.0%. Selling, general and administrative expenses grew faster than revenue, up 13.4% to ¥2,106 million, which consumed ¥248 million of the ¥547 million gross-profit gain; the remaining ¥298 million is the whole of the operating-profit increase, and the operating margin moved from 4.3% to 5.0%. The company says it pursued proposal-based selling and pushed technology development and rationalisation toward a more efficient production system, against a Japanese economy it describes as in moderate recovery on improving employment and income but still clouded by continued price rises, tensions in the Middle East and the direction of United States trade policy.
Below the operating line, a reversal and a merger loss pull in opposite directions
Non-operating income doubled, to ¥365 million from ¥179 million. The largest single item is an ¥80 million reversal of the allowance for doubtful accounts, which has no prior-year counterpart and which the balance sheet confirms: the allowance carried under investments and other assets fell from ¥80 million to zero. Interest income rose from ¥1 million to ¥34 million, equity-method investment gains from ¥20 million to ¥51 million, subsidy income from ¥3 million to ¥17 million, and a ¥17 million foreign-exchange gain replaced a ¥1 million loss. Dividend income was ¥88 million against ¥69 million. Non-operating expenses rose to ¥177 million from ¥117 million, almost entirely because interest paid rose to ¥156 million from ¥107 million — the cost of the short-term borrowing described below. Ordinary profit therefore rose 27.8% to ¥1,945 million, more than seven points faster than the operating line.
One line then works the other way. Aska booked an extraordinary loss of ¥138 million — a loss on extinguishment of shares arising from a merger — with no prior-year equivalent, so pre-tax profit rose only 18.7% to ¥1,806 million, slower than both the ordinary line and the operating line. The filing records no significant change in the scope of consolidation for the period, so the merger was internal to the existing group. Income taxes nonetheless fell, to ¥432 million from ¥477 million, taking the effective rate on pre-tax profit from 31.4% to 23.9%, and that is what carried profit attributable to owners of the parent up 31.5% to ¥1,373 million — the fastest-growing line in the statement. Non-controlling interests took ¥0.6 million. The filing gives no explanation for the lower tax charge.
Four of five segments grew; Control Systems swung to a loss
Auto Parts is effectively the group, at ¥27,654 million of segment revenue, up 3.2% — 78% of the five segments' combined ¥35,453 million — and it produced ¥1,168 million of segment profit, up 25.8%. The cause the filing gives is specific: parts and die sales rose overseas with the launch of new Mitsubishi-group vehicle models. That ¥240 million profit increase is four fifths of the group's ¥298 million operating-profit gain.
Control Systems is the exception. Revenue fell 15.6% to ¥2,156 million and the segment swung to an operating loss of ¥42 million from an ¥87 million profit a year earlier, a ¥130 million reversal, because the order backlog of project-based products at a principal customer declined. Robot Systems grew revenue only 2.0%, to ¥3,995 million, but lifted profit 26.2% to ¥428 million: domestic orders were absent this year after last year's new-customer wins, and firm overseas orders for automotive automation equipment more than made up the difference. Motorsports grew revenue 21.3% to ¥1,214 million on higher event sales and profit 265.3% to ¥107 million, the largest proportional move in the group off its smallest profit base. Leasing and Solar grew revenue 6.8% to ¥434 million and profit 30.3% to ¥94 million; the filing gives no reason for either.
The five segment revenues include ¥392 million of intersegment sales and transfers, which is why they total ¥35,453 million against group revenue of ¥35,061 million; the profit adjustment for intersegment elimination is a rounding-scale ¥0.7 million. Read together, the nine months are one segment's story with a single offset: Auto Parts added ¥240 million of profit, Robot Systems ¥89 million, Motorsports ¥78 million and Leasing and Solar ¥21 million, while Control Systems gave back ¥130 million.
The balance sheet grew on land, equipment and securities, funded by short-term borrowing
Total assets rose 8.4% to ¥43,797 million from ¥40,386 million at November 30, 2025, an increase of ¥3,411 million that the filing attributes mainly to growth in the other (net) line of property, plant and equipment. That line rose from ¥1,846 million to ¥3,911 million, land rose ¥974 million to ¥8,038 million, and investment securities rose ¥2,000 million to ¥6,287 million. Working the other way, cash and deposits fell ¥716 million to ¥2,092 million, work in process fell ¥524 million to ¥3,280 million, and electronically recorded monetary claims fell ¥219 million. No quarterly consolidated cash flow statement was prepared; the filing discloses only depreciation, of ¥1,634 million against ¥1,585 million.
Liabilities rose ¥1,518 million to ¥27,370 million, which the filing attributes mainly to short-term borrowings — these rose from ¥965 million to ¥3,930 million, an increase of ¥2,965 million, while electronically recorded obligations of ¥1,632 million at the previous year-end fell to zero and contract liabilities fell ¥432 million. Net assets rose ¥1,892 million to ¥16,427 million, mainly on retained earnings, which grew from ¥10,378 million to ¥11,383 million, and on unrealised gains on securities, which grew from ¥1,807 million to ¥2,614 million. The equity ratio improved from 36.0% to 37.5%. Comprehensive income was ¥2,261 million against ¥1,131 million, up 99.9%, and effectively the whole of that gap sits outside the profit lines: the securities revaluation added ¥807 million against ¥278 million, and the foreign-currency translation adjustment added ¥83 million where it had subtracted ¥191 million.
Guidance left unchanged — and it implies a much weaker fourth quarter
Aska repeated without revision the full-year FY11/2026 forecast it published on January 13, 2026: revenue of ¥47,000 million (+1.4%), operating profit of ¥2,200 million (+3.3%), ordinary profit of ¥2,200 million (+1.5%) and profit attributable to owners of ¥1,550 million (+1.9%), for earnings per share of ¥271.48. Nine months have delivered 74.6% of the guided revenue but 79.9% of the guided operating profit, 88.4% of the guided ordinary profit and 88.6% of the guided net profit.
Subtracting the nine months leaves an implied fourth quarter of about ¥11,938 million of revenue, ¥442 million of operating profit, ¥254 million of ordinary profit and ¥176 million of net profit, or roughly ¥30.86 per share against the ¥240.62 already earned. Two features of that stand out. The implied quarter is markedly less profitable than the nine months just reported, at an operating margin near 3.7% against 5.0%. And the implied ordinary profit is lower than the implied operating profit, reversing the pattern of the nine months, in which non-operating items added a net ¥187 million. The filing explains neither; it states only that there is no change to the January forecast.
The annual dividend holds at ¥54.00, with the split shifted forward
The dividend forecast is also unrevised. Aska paid ¥27.00 per share at the second quarter, against ¥16.00 a year earlier, and forecasts ¥27.00 at the year-end, against ¥38.00 — an unchanged annual total of ¥54.00. There is no third-quarter dividend and the filing gives no payment start date. Against guided earnings of ¥271.48 per share, ¥54.00 is a payout of about 19.9%. Two points of housekeeping close the document: the quarterly consolidated financial statements it contains have not been reviewed by a certified public accountant or audit firm, and the company prepared no supplementary explanatory material and held no results briefing. Issued shares were unchanged at 5,715,420 and treasury stock unchanged at 6,038.
| Metric | 9M FY11/2026 | 9M FY11/2025 | Change |
|---|---|---|---|
| Revenue (¥ million) | 35,061 | 34,271 | +2.3% |
| Cost of sales (¥ million) | 31,196 | 30,954 | +0.8% |
| Gross profit (¥ million) | 3,864 | 3,317 | +16.5% |
| Gross margin | 11.0% | 9.7% | +1.3 pt |
| SG&A expenses (¥ million) | 2,106 | 1,858 | +13.4% |
| Operating profit (¥ million) | 1,757 | 1,459 | +20.4% |
| Operating margin | 5.0% | 4.3% | +0.7 pt |
| Ordinary profit (¥ million) | 1,945 | 1,522 | +27.8% |
| Loss on extinguishment of shares (¥ million) | 138 | — | new |
| Pre-tax profit (¥ million) | 1,806 | 1,522 | +18.7% |
| Income taxes (¥ million) | 432 | 477 | −9.5% |
| Net profit attrib. to owners of parent (¥ million) | 1,373 | 1,044 | +31.5% |
| EPS (¥) | 240.62 | 182.92 | +31.5% |
| Comprehensive income (¥ million) | 2,261 | 1,131 | +99.9% |
| Auto Parts — revenue (¥ million) | 27,654 | 26,797 | +3.2% |
| Auto Parts — segment profit (¥ million) | 1,168 | 928 | +25.8% |
| Control Systems — revenue (¥ million) | 2,156 | 2,555 | −15.6% |
| Control Systems — segment profit (¥ million) | −42 | 87 | profit to loss |
| Robot Systems — revenue (¥ million) | 3,995 | 3,917 | +2.0% |
| Robot Systems — segment profit (¥ million) | 428 | 339 | +26.2% |
| Motorsports — revenue (¥ million) | 1,214 | 1,000 | +21.3% |
| Motorsports — segment profit (¥ million) | 107 | 29 | +265.3% |
| Leasing & Solar — revenue (¥ million) | 434 | 406 | +6.8% |
| Leasing & Solar — segment profit (¥ million) | 94 | 72 | +30.3% |
| Total assets (¥ million) | 43,797 | 40,386 | +8.4% |
| Net assets (¥ million) | 16,427 | 14,534 | +13.0% |
| Equity ratio | 37.5% | 36.0% | +1.5 pt |
| FY11/2026 guidance — revenue (¥ million) | 47,000 | — | +1.4% |
| FY11/2026 guidance — operating profit (¥ million) | 2,200 | — | +3.3% |
| FY11/2026 guidance — ordinary profit (¥ million) | 2,200 | — | +1.5% |
| FY11/2026 guidance — net profit (¥ million) | 1,550 | — | +1.9% |
| FY11/2026 guidance — EPS (¥) | 271.48 | — | n.m. |
| Annual dividend per share (¥) | 54.00 | 54.00 | unchanged |
JapanStockPulse provides informational content only and does not constitute investment advice. Figures are taken from the company's published earnings short report and may be subject to subsequent revision.