More procedures, fewer equipment orders
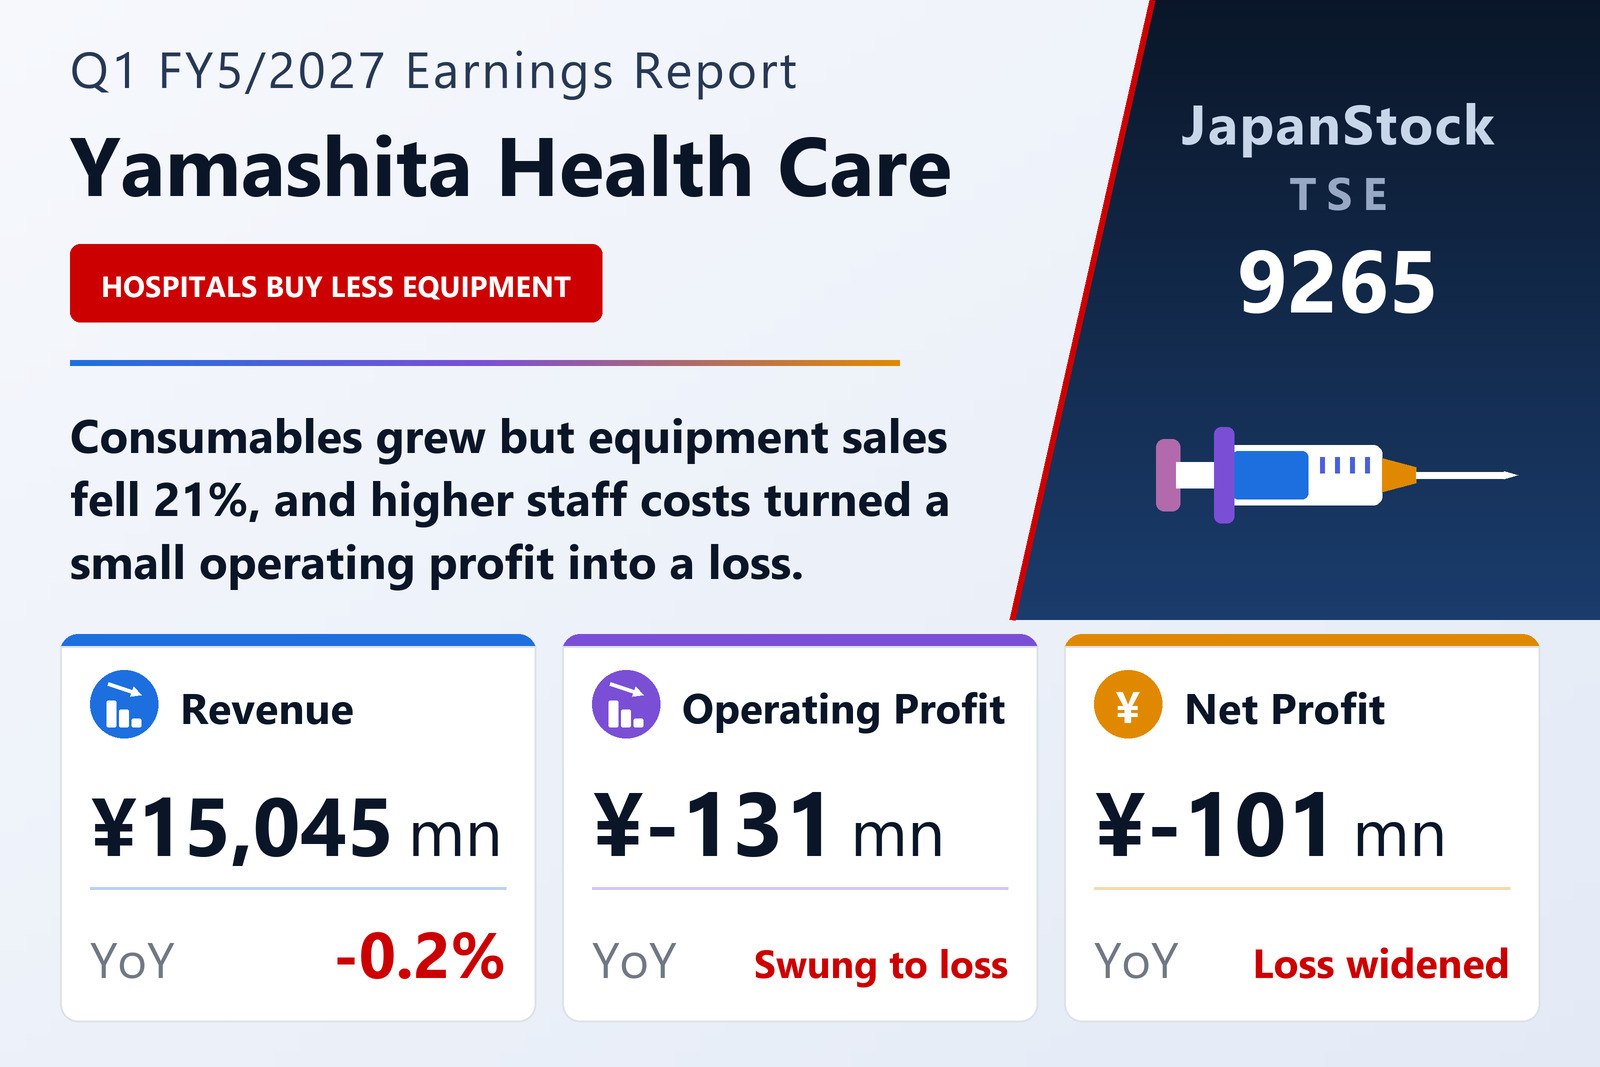
Yamashita Health Care Holdings, Inc. (TSE: 9265), the Fukuoka-based group whose core operating subsidiary distributes medical equipment and consumables to hospitals, published consolidated results for the first quarter of FY5/2027, the period from June 1 to August 31, 2026, on September 30, 2026 under Japanese GAAP. Revenue slipped 0.2% to ¥15,045 million; the company posted an operating loss of ¥131 million against a ¥36 million profit a year earlier, an ordinary loss of ¥106 million against a ¥67 million profit, and a net loss attributable to owners of the parent of ¥101 million, or ¥39.98 per share, against a ¥2 million loss.
The company says demand for consumables such as treatment materials grew as the number of examinations and operations rose, but hospitals' spending on equipment fell from a year earlier. It describes hospitals squeezed by continuing rises in personnel, utility and medical-material costs, with profitability not improving enough, and therefore cautious about capital investment and procurement.
A thinner gross margin and higher overheads
Cost of sales edged up 0.2% to ¥13,147 million while revenue edged down, so gross profit fell 3.3% to ¥1,897 million and the gross margin narrowed from 13.0% to 12.6%. Selling, general and administrative expenses rose 5.4% to ¥2,029 million, which the company attributes chiefly to higher personnel costs. The ¥65 million drop in gross profit and the ¥104 million increase in overheads together account for the ¥167 million swing from operating profit to loss. A ¥6 million gain on the sale of investment securities and income taxes of just ¥1 million, against ¥71 million a year earlier, left the net loss close to the pre-tax loss of ¥100 million.
Equipment sales fall 21%, consumables grow
The Medical Device Sales segment, almost all of the group, produced revenue of ¥15,068 million (−0.1%) including internal sales, and segment profit fell 40.5% to ¥212 million. By product field, general equipment — general fixtures plus imaging systems such as MRI and CT, radiological equipment and ultrasound — fell 21.2% to ¥1,250 million, and information and services, mainly facility maintenance, fell 21.4% to ¥279 million. General consumables, the largest field, grew 4.9% to ¥6,815 million; minimally invasive treatment, covering endoscopy, surgical and cardiovascular products, rose 1.9% to ¥3,540 million; and specialty fields, led by dialysis and orthopaedic products, were flat at ¥3,182 million.
The Device Manufacturing & Sales segment, which makes the group's own orthopaedic implants and develops ultrasound-based devices, held revenue at ¥54 million and narrowed its segment loss to ¥20 million from ¥63 million. The Medical Mall segment earned ¥1 million on ¥17 million of mainly rental revenue. Corporate costs not allocated to segments rose to ¥311 million from ¥248 million.
Cash spent on a logistics centre and on paying suppliers
Total assets fell ¥1,691 million to ¥25,397 million from May 31, 2026. Cash and deposits dropped to ¥1,918 million from ¥4,127 million, while construction in progress rose to ¥1,421 million from ¥862 million as the core subsidiary expands its Tosu logistics centre and installs material-handling equipment — automated warehousing, transport robots and warehouse-management systems — to automate operations. On the other side, electronically recorded obligations to suppliers fell by ¥1,878 million as payables carried at the year end fell due, and the company took on ¥1,000 million of short-term borrowings as working capital to settle them. Net assets fell to ¥9,034 million; with the smaller balance sheet, the equity ratio rose from 34.6% to 35.6%.
Guidance and dividend unchanged
The company left unchanged the full-year forecast it published on July 13, 2026: revenue of ¥69,794 million (+8.8%), operating profit of ¥833 million (+13.1%), ordinary profit of ¥855 million (−2.4%) and profit attributable to owners of the parent of ¥553 million (−14.6%), or ¥217.65 per share. FY5/2027 is the final year of its medium-term management plan. The dividend forecast is also unchanged at a year-end ¥65.00 per share, against ¥107.00 for FY5/2026; the filing gives no reason for the lower payout.
| Metric | Q1 FY5/2027 | Q1 FY5/2026 | Change |
|---|---|---|---|
| Revenue (¥ million) | 15,045 | 15,078 | −0.2% |
| Cost of sales (¥ million) | 13,147 | 13,115 | +0.2% |
| Gross profit (¥ million) | 1,897 | 1,962 | −3.3% |
| Gross margin | 12.6% | 13.0% | −0.4 pt |
| SG&A expenses (¥ million) | 2,029 | 1,925 | +5.4% |
| Operating profit (¥ million) | −131 | 36 | profit to loss |
| Ordinary profit (¥ million) | −106 | 67 | profit to loss |
| Pre-tax profit (¥ million) | −100 | 67 | profit to loss |
| Net profit attrib. to owners of parent (¥ million) | −101 | −2 | loss widened |
| EPS (¥) | −39.98 | −0.84 | loss widened |
| Comprehensive income (¥ million) | −53 | −21 | loss widened |
| Medical Device Sales — revenue (¥ million) | 15,068 | 15,090 | −0.1% |
| Medical Device Sales — segment profit (¥ million) | 212 | 357 | −40.5% |
| Sales: general equipment — revenue (¥ million) | 1,250 | 1,587 | −21.2% |
| Sales: general consumables — revenue (¥ million) | 6,815 | 6,495 | +4.9% |
| Sales: minimally invasive — revenue (¥ million) | 3,540 | 3,476 | +1.9% |
| Sales: specialty fields — revenue (¥ million) | 3,182 | 3,176 | +0.2% |
| Sales: information & services — revenue (¥ million) | 279 | 355 | −21.4% |
| Device Manufacturing & Sales — revenue (¥ million) | 54 | 54 | +0.4% |
| Device Manufacturing & Sales — segment profit (¥ million) | −20 | −63 | loss narrowed |
| Medical Mall — revenue (¥ million) | 17 | 17 | −0.1% |
| Medical Mall — segment profit (¥ million) | 1 | 1 | −1.2% |
| Total assets (¥ million) | 25,397 | 27,089 | −6.2% |
| Net assets (¥ million) | 9,034 | 9,360 | −3.5% |
| Equity ratio | 35.6% | 34.6% | +1.0 pt |
| FY5/2027 guidance — revenue (¥ million) | 69,794 | — | +8.8% |
| FY5/2027 guidance — operating profit (¥ million) | 833 | — | +13.1% |
| FY5/2027 guidance — ordinary profit (¥ million) | 855 | — | −2.4% |
| FY5/2027 guidance — net profit (¥ million) | 553 | — | −14.6% |
| FY5/2027 guidance — EPS (¥) | 217.65 | — | n.m. |
| Annual dividend per share (¥) | 65.00 | 107.00 | −39.3% |
JapanStockPulse provides informational content only and does not constitute investment advice. Figures are taken from the company's published earnings short report and may be subject to subsequent revision.