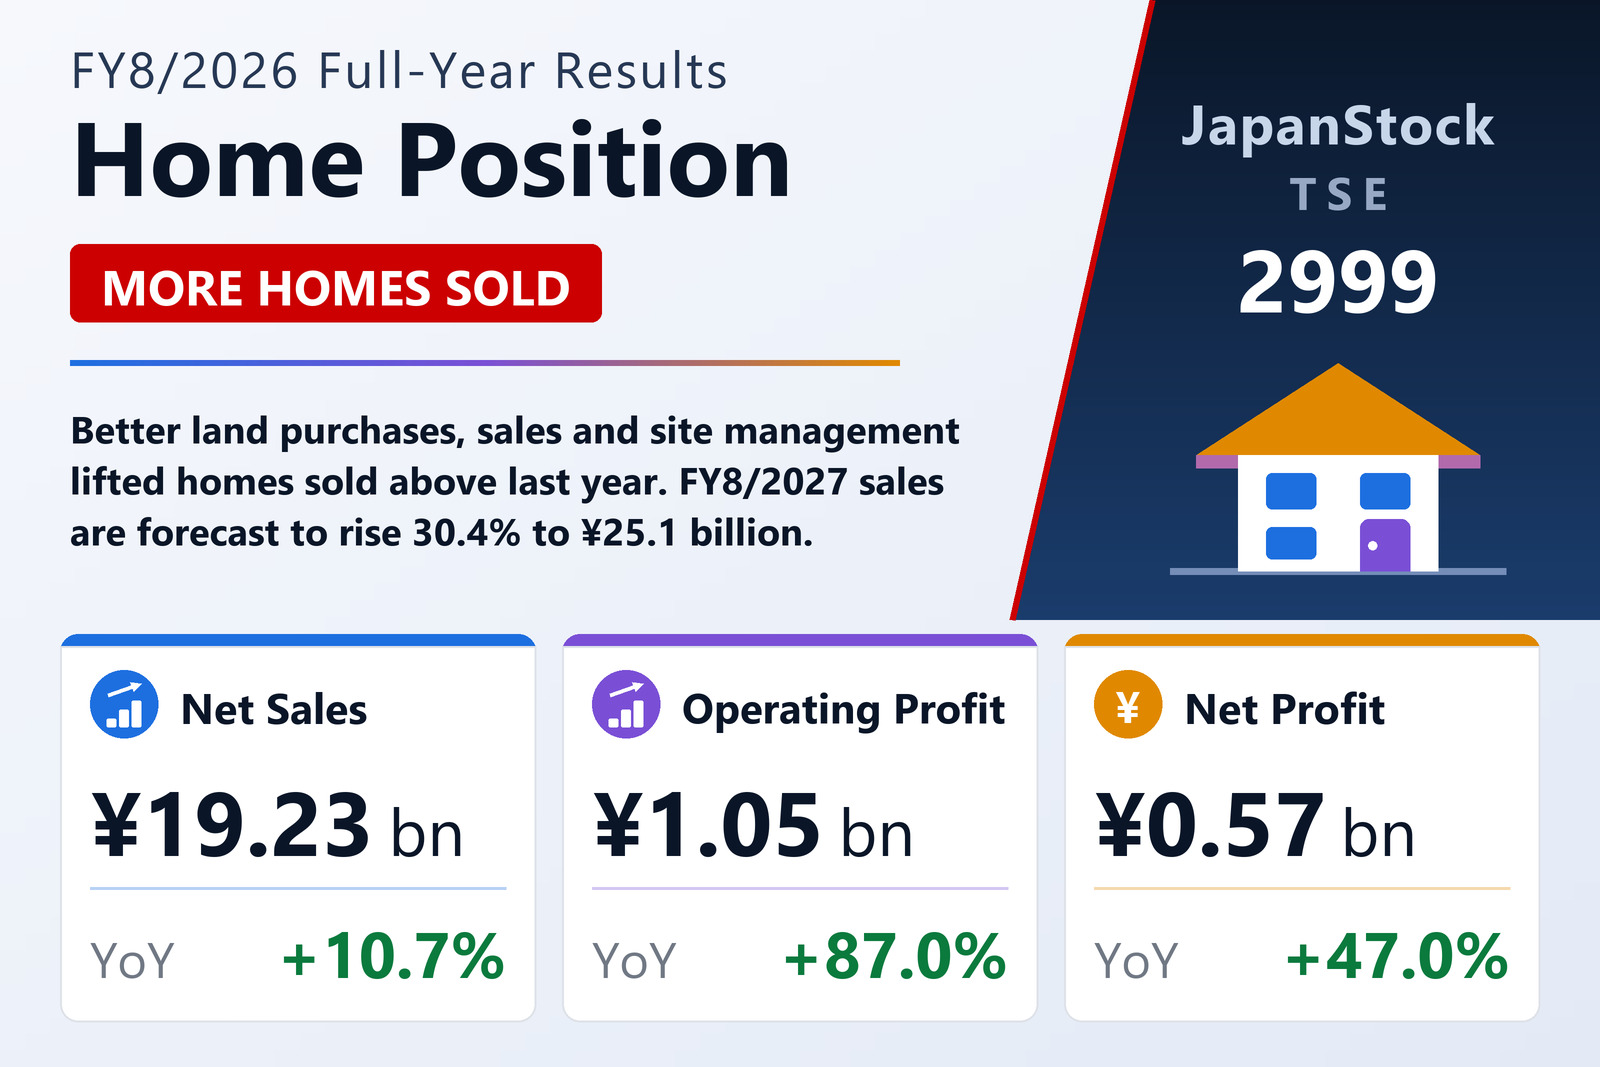
More homes sold
Home Position Co., Ltd. (TSE: 2999), which builds and sells ready-built detached houses, reported non-consolidated results for FY8/2026, the year from September 1, 2025 to August 31, 2026, on October 9, 2026 under Japanese GAAP. Net sales rose 10.7% to ¥19,226 million, operating profit 87.0% to ¥1,054 million and ordinary profit 98.4% to ¥803 million. Net profit rose 47.0% to ¥569 million, or ¥60.71 per share against ¥42.93.
The company said house prices kept rising on high building and labour costs while real wages lagged and higher mortgage rates made some buyers cautious. Against that, it strengthened purchases of good-quality land, made sales more efficient and improved construction management, and the number of homes sold exceeded the previous year. Home Position has a single segment, detached-house sales.
Balance sheet and outlook
Total assets rose 23.9% to ¥17,934 million, mainly because real estate for sale under construction increased by ¥3,899 million to ¥11,437 million. Net assets rose 8.4% to ¥6,256 million, and the equity ratio fell to 34.9% from 39.9%. The annual dividend is unchanged at ¥10, and the same is planned for FY8/2027.
For FY8/2027 the company plans to strengthen sales and construction in each area and raise inventory turnover, and expects a sharp rise in sales from more homes sold: net sales of ¥25,080 million (+30.4%), operating profit of ¥1,107 million (+5.0%), ordinary profit of ¥785 million (−2.3%) and net profit of ¥543 million (−4.7%).
| Metric | FY8/2026 | FY8/2025 | Change |
|---|---|---|---|
| Net sales (¥ million) | 19,226 | 17,364 | +10.7% |
| Operating profit (¥ million) | 1,054 | 563 | +87.0% |
| Ordinary profit (¥ million) | 803 | 405 | +98.4% |
| Net profit (¥ million) | 569 | 387 | +47.0% |
| EPS (¥) | 60.71 | 42.93 | +41.4% |
| Total assets (¥ million) | 17,934 | 14,473 | +23.9% |
| Net assets (¥ million) | 6,256 | 5,769 | +8.4% |
| Equity ratio | 34.9% | 39.9% | −5.0 pt |
| FY8/2027 guidance — revenue (¥ million) | 25,080 | — | +30.4% |
| FY8/2027 guidance — operating profit (¥ million) | 1,107 | — | +5.0% |
| FY8/2027 guidance — ordinary profit (¥ million) | 785 | — | −2.3% |
| FY8/2027 guidance — net profit (¥ million) | 543 | — | −4.7% |
| Annual dividend per share (¥) | 10.00 | 10.00 | unchanged |
JapanStockPulse provides informational content only and does not constitute investment advice. Figures are taken from the company's published earnings short report and may be subject to subsequent revision.