Acquisitions drive growth
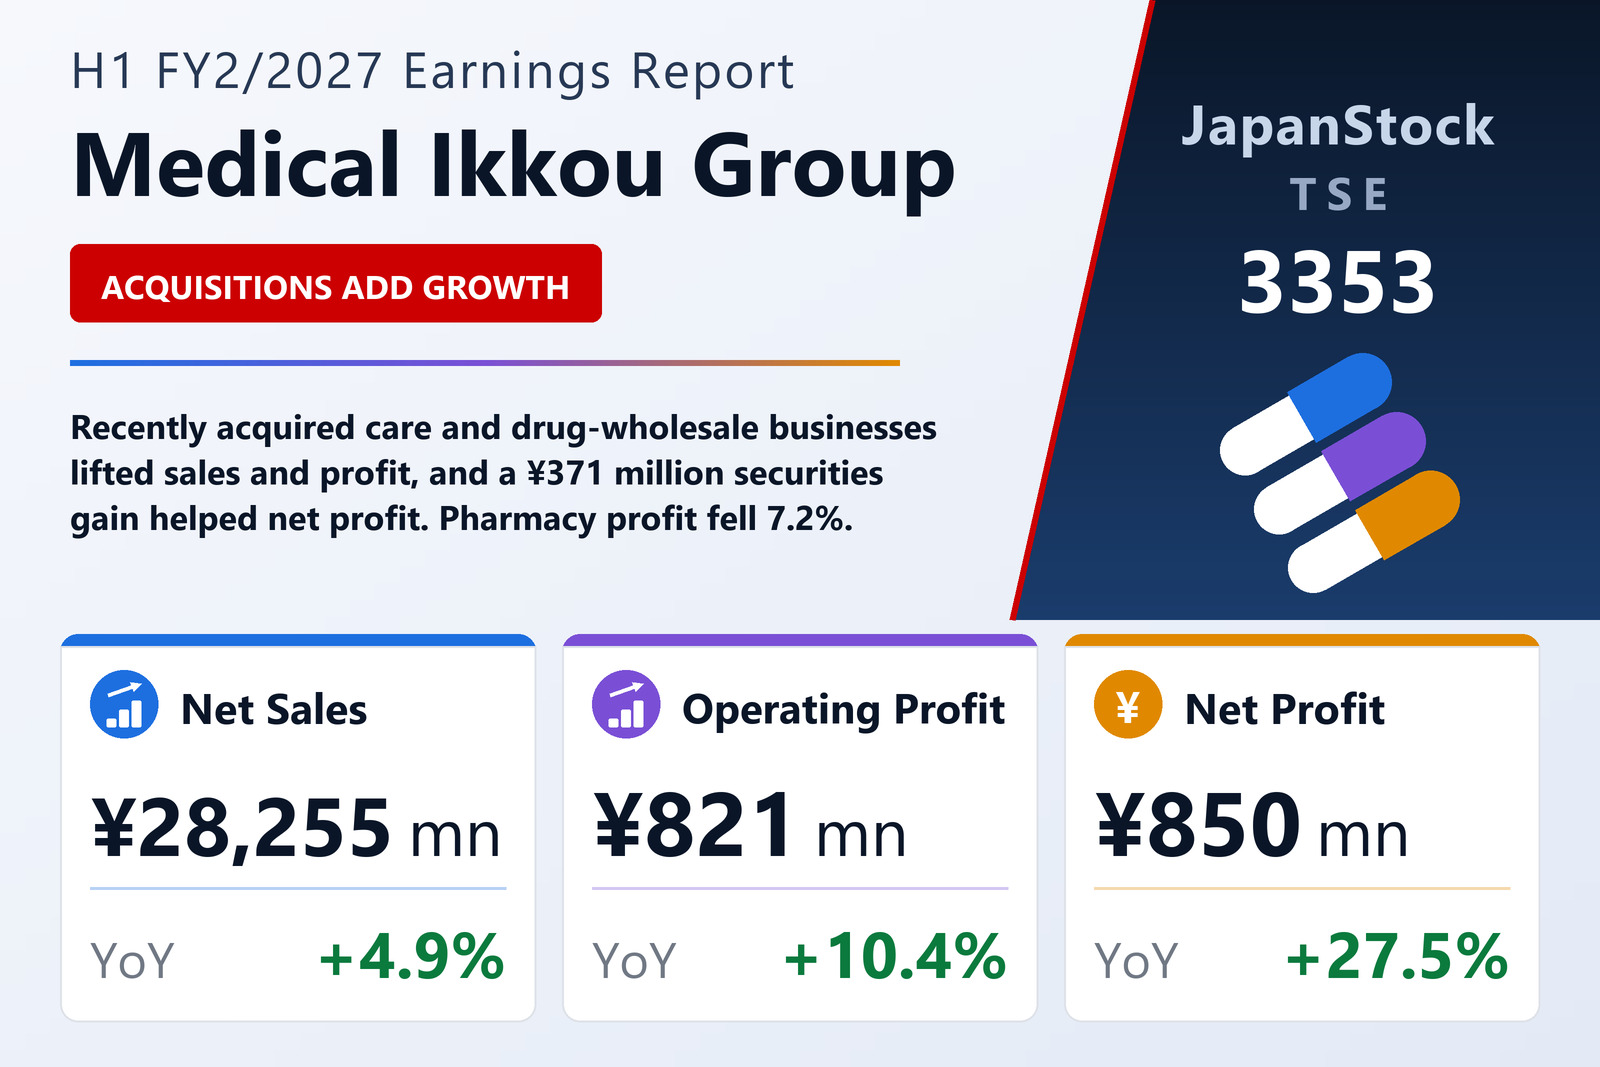
Medical Ikkou Group Co., Ltd. (TSE: 3353), which runs dispensing pharmacies, care facilities and a pharmaceutical wholesale business, reported consolidated results for the first half of FY2/2027, the six months from March 1 to August 31, 2026, on October 9, 2026 under Japanese GAAP. Net sales rose 4.9% to ¥28,255 million, EBITDA 9.1% to ¥1,250 million and operating profit 10.4% to ¥821 million. Ordinary profit rose 29.0% to ¥1,135 million, and net profit attributable to owners of the parent 27.5% to ¥850 million, or ¥225.77 per share against ¥177.23.
The company said its businesses are largely priced by the government, making it hard to pass on rising costs, so it is expanding through scale and efficiency; in the half it took over a pharmaceutical wholesale business in Saga Prefecture and plans more acquisitions. It also booked a ¥371 million gain on the sale of investment securities.
Segments
Dispensing pharmacy sales rose 1.2% to ¥13,215 million as higher prices per prescription offset fewer prescriptions, but segment profit fell 7.2% to ¥610 million; the group had 97 pharmacies at the end of August. Healthcare sales rose 6.9% to ¥4,685 million and profit rose 212.6% to ¥44 million, helped by higher occupancy at new facilities and a full half of Sunrise Villa Tsuchiura, acquired in August 2025; wage-increase subsidies were booked as non-operating income. Pharmaceutical wholesale sales rose 9.0% to ¥10,219 million and profit 66.3% to ¥148 million, helped by three companies that joined from May 2025. Real estate earned ¥81 million on sales of ¥135 million.
Balance sheet and outlook
Total assets were broadly flat at ¥37,521 million, and net assets rose 2.2% to ¥16,692 million, for an equity ratio of 42.7%. The interim dividend is ¥60, and the full-year dividend is planned at ¥120, unchanged.
The full-year forecast is unchanged: net sales of ¥56,500 million (+2.8%), operating profit of ¥1,800 million (+0.7%), ordinary profit of ¥1,850 million (−0.5%) and net profit of ¥1,300 million (+2.0%).
| Metric | H1 FY2/2027 | H1 FY2/2026 | Change |
|---|---|---|---|
| Net sales (¥ million) | 28,255 | 26,935 | +4.9% |
| EBITDA (¥ million) | 1,250 | 1,145 | +9.1% |
| Operating profit (¥ million) | 821 | 743 | +10.4% |
| Ordinary profit (¥ million) | 1,135 | 880 | +29.0% |
| Net profit attrib. to owners of parent (¥ million) | 850 | 666 | +27.5% |
| EPS (¥) | 225.77 | 177.23 | +27.4% |
| Total assets (¥ million) | 37,521 | 37,576 | −0.1% |
| Net assets (¥ million) | 16,692 | 16,338 | +2.2% |
| Equity ratio | 42.7% | 41.7% | +1.0 pt |
| FY2/2027 guidance — revenue (¥ million) | 56,500 | — | +2.8% |
| FY2/2027 guidance — operating profit (¥ million) | 1,800 | — | +0.7% |
| FY2/2027 guidance — ordinary profit (¥ million) | 1,850 | — | −0.5% |
| FY2/2027 guidance — net profit (¥ million) | 1,300 | — | +2.0% |
| Annual dividend per share (¥) | 120.00 | 120.00 | unchanged |
JapanStockPulse provides informational content only and does not constitute investment advice. Figures are taken from the company's published earnings short report and may be subject to subsequent revision.