Semiconductor materials lead
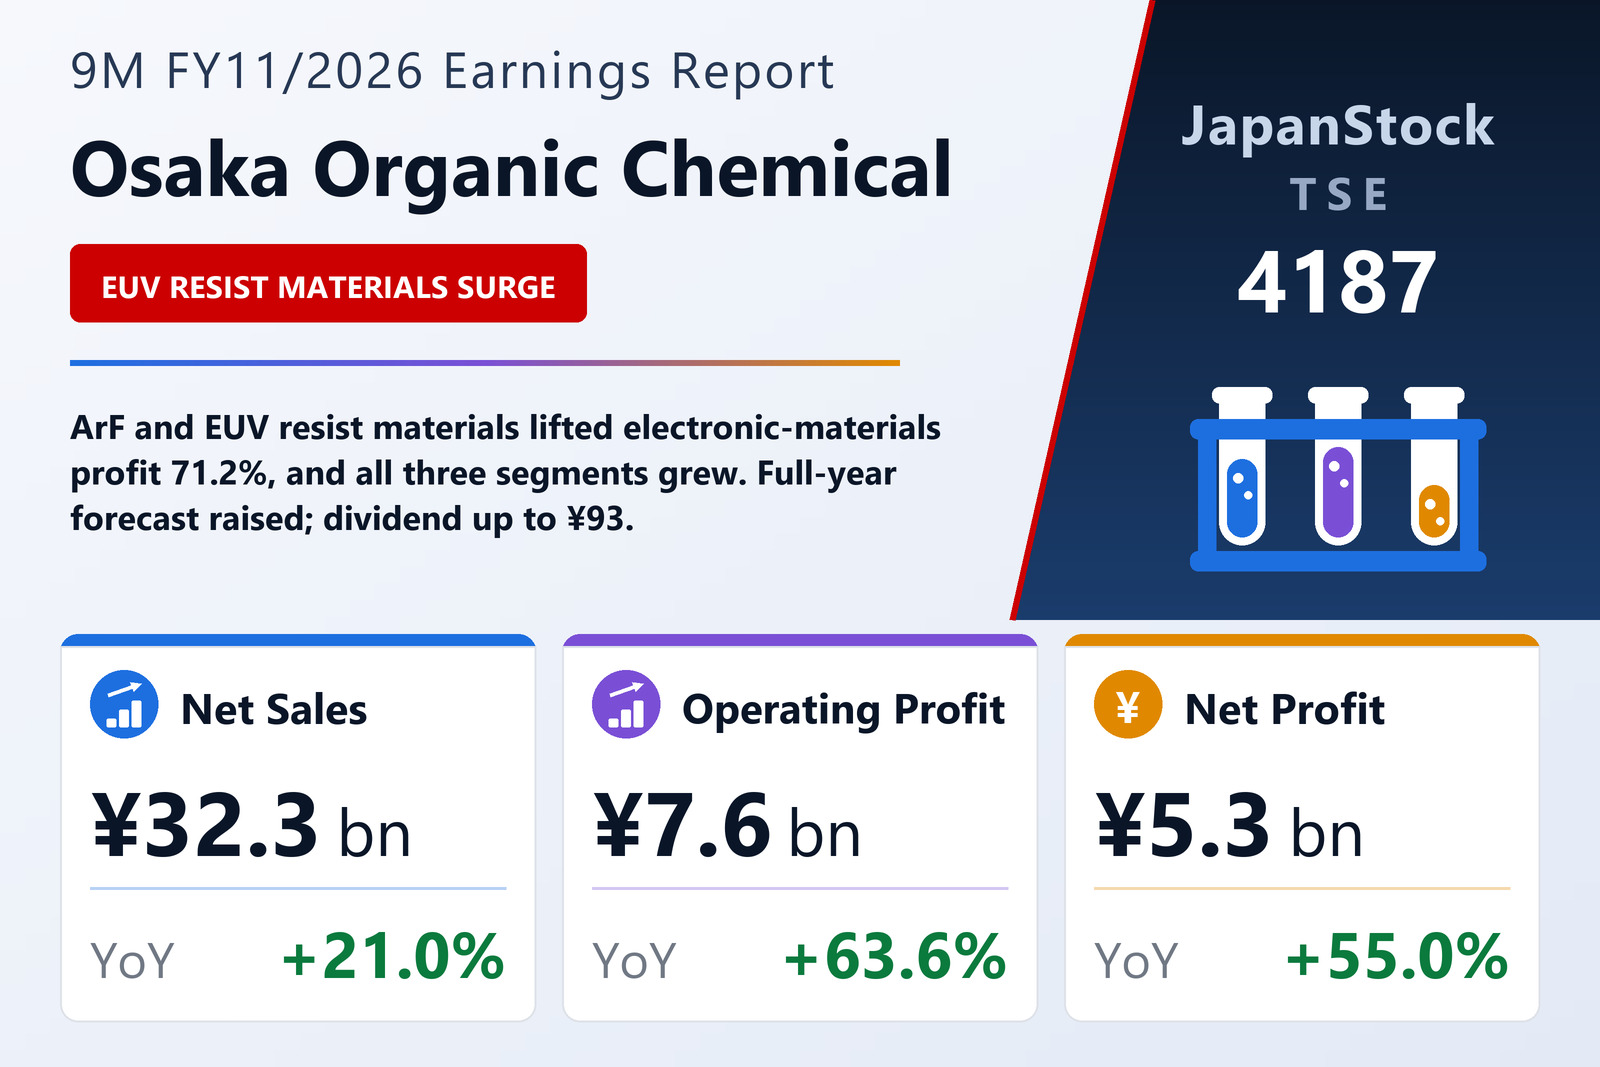
Osaka Organic Chemical Industry Ltd. (TSE: 4187), the Osaka-based maker of specialty acrylic esters, reported consolidated results for the first nine months of FY11/2026, from December 1, 2025 to August 31, 2026, on October 9, 2026 under Japanese GAAP. Net sales rose 21.0% to ¥32,293 million, operating profit 63.6% to ¥7,578 million and ordinary profit 62.9% to ¥7,893 million. Net profit attributable to owners of the parent rose 55.0% to ¥5,325 million, or ¥261.86 per share against ¥167.63.
The electronic materials segment grew sales 27.0% to ¥15,571 million and segment profit 71.2% to ¥3,609 million, as sales of raw materials for ArF resists, its mainstay, and for leading-edge EUV resists rose sharply on AI-related semiconductor demand; display materials sales fell. The company is building new capacity for advanced semiconductor materials at its Sakata plant and has formed a capital and business alliance with Sanpo Kagaku Kenkyusho to share purification and production know-how.
Chemicals and functional chemicals
The chemicals segment grew sales 11.5% to ¥11,059 million on strong demand from automotive coatings and steady demand from optical adhesives, and price optimization and a better product mix lifted profit 49.4% to ¥2,461 million. The functional chemicals segment grew sales 25.2% to ¥5,664 million and profit 78.1% to ¥1,577 million on strong cosmetics raw materials, a sharp rise in functional materials and high-purity specialty solvents sold by a subsidiary. Visnex Chemicals Corporation was newly consolidated in the period.
Balance sheet, dividend and outlook
Total assets rose 7.2% to ¥68,284 million from the end of November, mainly on receivables and investment securities lifted by higher share prices, and net assets 11.1% to ¥56,144 million, for an equity ratio of 80.6%. The company raised its annual dividend forecast to ¥93, an interim ¥43 plus a planned year-end ¥50, against ¥75 for FY11/2025.
It also raised its full-year forecast, last revised on July 2, to net sales of ¥42,500 million (+17.2%), operating profit of ¥9,300 million (+50.3%) and ordinary profit of ¥9,600 million (+46.4%). Net profit is forecast at ¥6,600 million, 4.2% below the previous year.
| Metric | 9M FY11/2026 | 9M FY11/2025 | Change |
|---|---|---|---|
| Net sales (¥ million) | 32,293 | 26,699 | +21.0% |
| Operating profit (¥ million) | 7,578 | 4,631 | +63.6% |
| Ordinary profit (¥ million) | 7,893 | 4,844 | +62.9% |
| Net profit attrib. to owners of parent (¥ million) | 5,325 | 3,435 | +55.0% |
| EPS (¥) | 261.86 | 167.63 | +56.2% |
| Comprehensive income (¥ million) | 7,208 | 3,792 | +90.0% |
| Chemicals — revenue (¥ million) | 11,059 | 9,916 | +11.5% |
| Chemicals — segment profit (¥ million) | 2,461 | 1,648 | +49.4% |
| Electronic materials — revenue (¥ million) | 15,571 | 12,260 | +27.0% |
| Electronic materials — segment profit (¥ million) | 3,609 | 2,108 | +71.2% |
| Functional chemicals — revenue (¥ million) | 5,664 | 4,523 | +25.2% |
| Functional chemicals — segment profit (¥ million) | 1,577 | 886 | +78.1% |
| Total assets (¥ million) | 68,284 | 63,713 | +7.2% |
| Net assets (¥ million) | 56,144 | 50,536 | +11.1% |
| Equity ratio | 80.6% | 78.0% | +2.6 pt |
| FY11/2026 guidance — revenue (¥ million) | 42,500 | — | +17.2% |
| FY11/2026 guidance — operating profit (¥ million) | 9,300 | — | +50.3% |
| FY11/2026 guidance — ordinary profit (¥ million) | 9,600 | — | +46.4% |
| FY11/2026 guidance — net profit (¥ million) | 6,600 | — | −4.2% |
| Annual dividend per share (¥) | 93.00 | 75.00 | +24.0% |
JapanStockPulse provides informational content only and does not constitute investment advice. Figures are taken from the company's published earnings short report and may be subject to subsequent revision.