Lower cost ratios lift margins
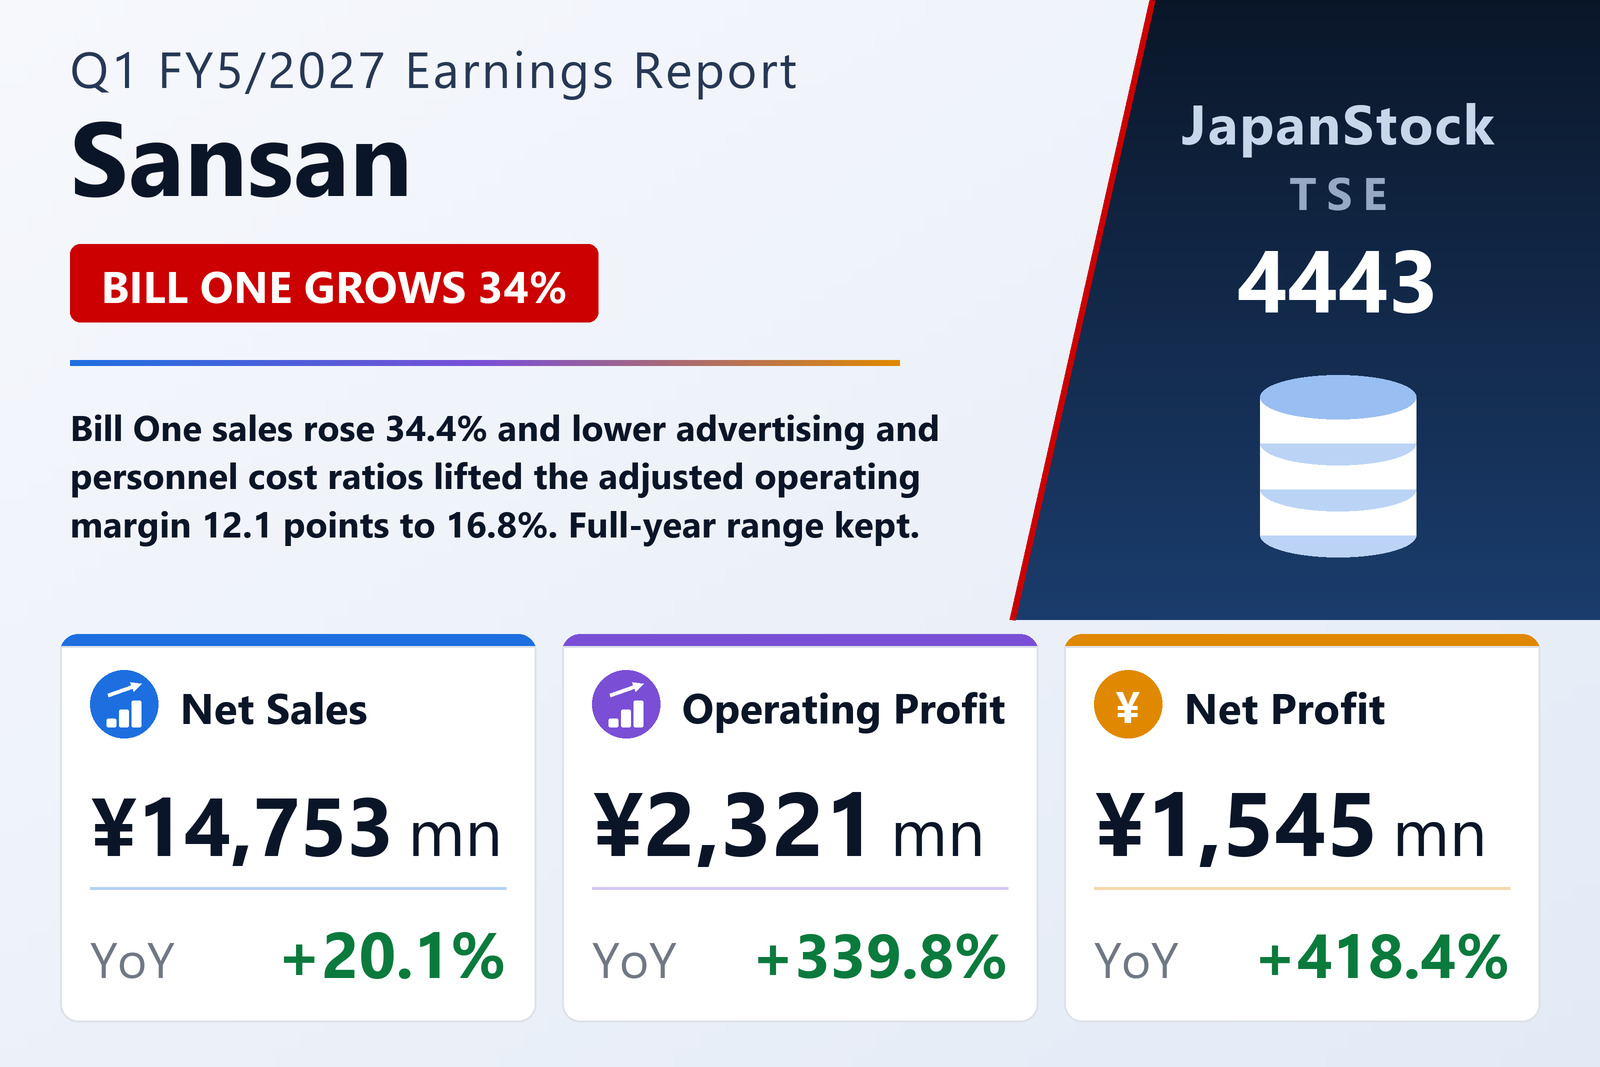
Sansan, Inc. (TSE: 4443), which turns business cards, invoices and contracts into structured data through cloud software combined with human operators, reported consolidated results for the first quarter of FY5/2027, June 1 to August 31, 2026, on October 9, 2026 under Japanese GAAP. Net sales rose 20.1% to ¥14,753 million and gross profit 19.8% to ¥12,926 million, a gross margin of 87.6%. Adjusted operating profit rose 328.3% to ¥2,475 million, lifting the adjusted margin by 12.1 points to 16.8%, mainly because advertising and personnel costs fell as a share of sales. Operating profit rose 339.8% to ¥2,321 million and net profit attributable to owners of the parent 418.4% to ¥1,545 million, or ¥12.32 per share against ¥2.36.
Segments
The Sansan/Bill One segment's sales rose 18.4% to ¥12,953 million and adjusted operating profit 306.3% to ¥2,734 million. Sansan sales rose 9.8% to ¥8,231 million, with recurring revenue up 12.1% to ¥7,797 million and contracts up 13.7% to 12,580 as small and mid-sized customers signed up. Bill One sales rose 34.4% to ¥4,067 million, monthly recurring revenue 33.0% to ¥1,311 million and paying contracts 28.6% to 5,468. Other services, led by the Contract One contract-management service, grew 57.6% to ¥654 million.
The Eight segment, built around the Eight business-card app, grew sales 32.6% to ¥1,719 million on event and recruitment services, including Eight Career, consolidated in January 2026. It posted an adjusted operating loss of ¥166 million, against ¥57 million a year earlier, as it added staff for growth in the second half, but expects an adjusted operating profit for the full year.
Balance sheet and outlook
Total assets fell 4.4% to ¥52,527 million and net assets were steady at ¥21,123 million, for an equity ratio of 38.1%. The company plans an annual dividend of ¥5.00 (¥2.50 interim and ¥2.50 year-end), against ¥2.50 for the previous year.
The full-year forecast, given as a range, is unchanged: net sales of ¥63,706–65,319 million (+18.5% to +21.5%), adjusted operating profit of ¥12,741–14,696 million, operating profit of ¥12,514–14,464 million and net profit attributable to owners of the parent of ¥8,376–10,221 million.
| Metric | Q1 FY5/2027 | Q1 FY5/2026 | Change |
|---|---|---|---|
| Net sales (¥ million) | 14,753 | 12,283 | +20.1% |
| Adjusted operating profit (¥ million) | 2,475 | 578 | +328.3% |
| Operating profit (¥ million) | 2,321 | 527 | +339.8% |
| Ordinary profit (¥ million) | 2,365 | 528 | +347.7% |
| Net profit attrib. to owners of parent (¥ million) | 1,545 | 298 | +418.4% |
| EPS (¥) | 12.32 | 2.36 | +422.0% |
| Total assets (¥ million) | 52,527 | 54,958 | −4.4% |
| Net assets (¥ million) | 21,123 | 21,094 | +0.1% |
| Equity ratio | 38.1% | 36.4% | +1.7 pt |
| Annual dividend per share (¥) | 5.00 | 2.50 | +100.0% |
JapanStockPulse provides informational content only and does not constitute investment advice. Figures are taken from the company's published earnings short report and may be subject to subsequent revision.