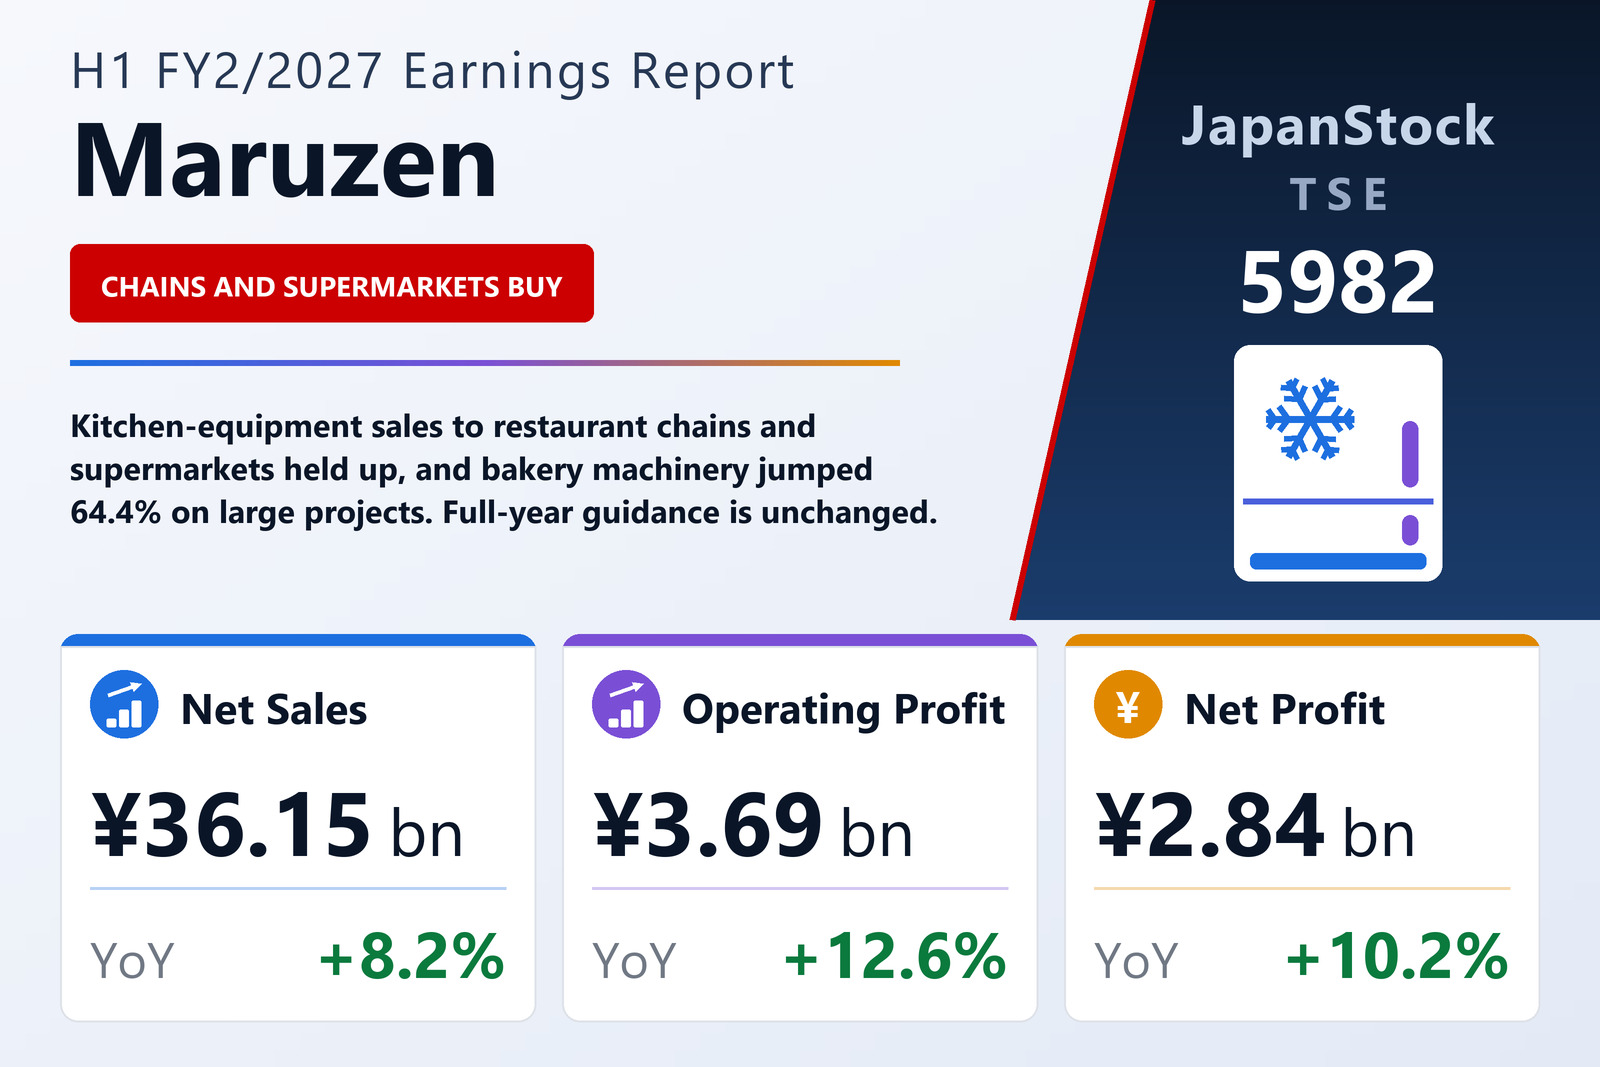
Steady demand from chains and supermarkets
Maruzen Co., Ltd. (TSE: 5982), a maker of commercial kitchen equipment, reported consolidated results for the first half of FY2/2027, the six months from March 1 to August 31, 2026, on October 9, 2026 under Japanese GAAP. Net sales rose 8.2% to ¥36,145 million, operating profit 12.6% to ¥3,688 million and ordinary profit 12.8% to ¥4,114 million. Net profit attributable to owners of the parent rose 10.2% to ¥2,841 million, or ¥178.66 per share against ¥162.71.
The company said consumer sentiment in the restaurant industry, one of its main customer groups, has stopped falling, but price-conscious behaviour and labour shortages persist and conditions vary widely by type of business.
Segments
Commercial kitchen equipment, the core business, grew sales 5.9% to ¥33,694 million on steady sales to restaurant chains and food supermarkets, and absorbed higher material, logistics and personnel costs to raise operating profit 7.9% to ¥3,636 million. Large bakery machinery, sold to bread makers and other food factories in Japan and abroad, grew sales 64.4% to ¥2,212 million with the help of large projects, and operating profit rose 98.5% to ¥353 million. Building leasing earned ¥155 million on sales of ¥246 million, in line with plan.
Balance sheet and outlook
Total assets rose 1.1% to ¥75,370 million, partly because the company bought land in Koshigaya, Saitama Prefecture, and net assets rose 3.4% to ¥54,067 million, lifting the equity ratio to 71.7%. The interim dividend is ¥60, and the full-year dividend is planned at ¥125, unchanged.
The full-year forecast issued on April 10, 2026 is unchanged: net sales of ¥67,000 million (+0.3%), operating profit of ¥6,700 million (+1.0%), ordinary profit of ¥7,400 million (+0.8%) and net profit of ¥5,300 million (+1.6%).
| Metric | H1 FY2/2027 | H1 FY2/2026 | Change |
|---|---|---|---|
| Net sales (¥ million) | 36,145 | 33,396 | +8.2% |
| Operating profit (¥ million) | 3,688 | 3,276 | +12.6% |
| Ordinary profit (¥ million) | 4,114 | 3,648 | +12.8% |
| Net profit attrib. to owners of parent (¥ million) | 2,841 | 2,577 | +10.2% |
| EPS (¥) | 178.66 | 162.71 | +9.8% |
| Total assets (¥ million) | 75,370 | 74,548 | +1.1% |
| Net assets (¥ million) | 54,067 | 52,292 | +3.4% |
| Equity ratio | 71.7% | 70.1% | +1.6 pt |
| FY2/2027 guidance — revenue (¥ million) | 67,000 | — | +0.3% |
| FY2/2027 guidance — operating profit (¥ million) | 6,700 | — | +1.0% |
| FY2/2027 guidance — ordinary profit (¥ million) | 7,400 | — | +0.8% |
| FY2/2027 guidance — net profit (¥ million) | 5,300 | — | +1.6% |
| Annual dividend per share (¥) | 125.00 | 125.00 | unchanged |
JapanStockPulse provides informational content only and does not constitute investment advice. Figures are taken from the company's published earnings short report and may be subject to subsequent revision.