Strong demand, a costly system switch
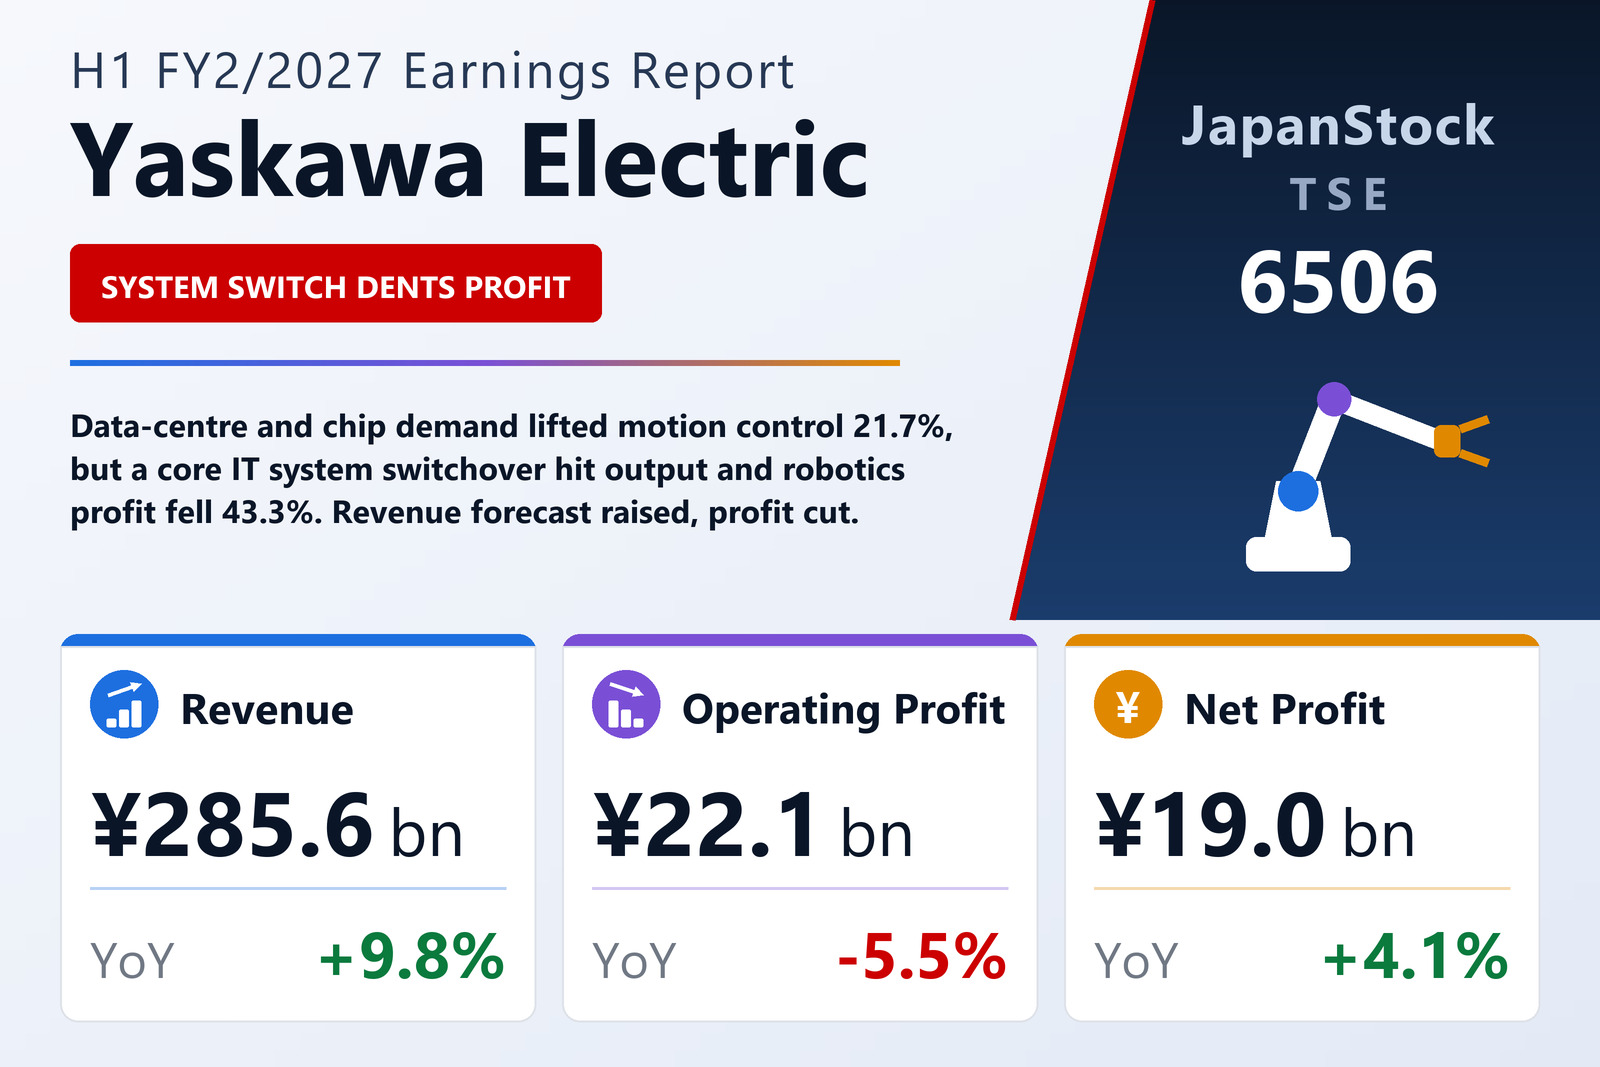
Yaskawa Electric Corporation (TSE: 6506), a maker of servo motors, inverters and industrial robots, reported consolidated results for the first half of FY2/2027, the six months from March 1 to August 31, 2026, on October 9, 2026 under IFRS. Revenue rose 9.8% to ¥285,598 million, while operating profit fell 5.5% to ¥22,058 million. Profit before tax rose 3.0% to ¥25,963 million and profit attributable to owners of the parent 4.1% to ¥18,988 million, or ¥73.21 per share against ¥70.36. The average dollar rate was ¥159.82, against ¥146.23 a year earlier.
The company said capital spending on data centres and semiconductors, driven by AI investment, stayed strong, and automation demand in general industry held up. Demand was high in the Americas, including large oil and gas projects, and in China and in South Korea and Taiwan on semiconductor investment, while European carmakers remained cautious.
Segments
Motion control revenue rose 21.7% to ¥137,286 million and operating profit 32.8% to ¥15,973 million, as servo motor and controller sales grew in every region and inverter sales rose on data-centre, chip-equipment and oil and gas demand. Robotics revenue slipped 0.7% to ¥118,404 million: sales grew in the Americas and China, but the system switchover cut sales in Japan, and operating profit fell 43.3% to ¥5,974 million, also hit by the European restructuring costs. System engineering revenue rose 11.2% to ¥20,778 million on port-crane sales, and its operating profit rose 79.5% to ¥3,480 million.
Balance sheet and outlook
Total assets rose 3.8% to ¥842,833 million, and equity attributable to owners of the parent 4.3% to ¥504,101 million, for an equity ratio of 59.8%. Operating cash flow rose by ¥29,823 million to ¥45,628 million. The interim dividend is ¥36, and the full-year dividend is planned at ¥72, against ¥68.
Yaskawa revised the forecast it issued on April 10, 2026, raising its second-half exchange-rate assumptions to ¥155 to the dollar from ¥145 and ¥180 to the euro from ¥170 while factoring in the system switchover's impact: revenue of ¥600,000 million (+10.7%), up from ¥580,000 million; operating profit of ¥57,500 million (+21.5%), down from ¥60,000 million; profit before tax of ¥65,500 million (+32.2%), up from ¥65,000 million; and profit attributable to owners of the parent of ¥47,500 million (+34.8%), up from ¥47,000 million.
| Metric | H1 FY2/2027 | H1 FY2/2026 | Change |
|---|---|---|---|
| Revenue (¥ million) | 285,598 | 260,195 | +9.8% |
| Operating profit (¥ million) | 22,058 | 23,334 | −5.5% |
| Pre-tax profit (¥ million) | 25,963 | 25,204 | +3.0% |
| Net profit attrib. to owners of parent (¥ million) | 18,988 | 18,247 | +4.1% |
| EPS (¥) | 73.21 | 70.36 | +4.1% |
| Motion control — revenue (¥ million) | 137,286 | 112,837 | +21.7% |
| Motion control — segment profit (¥ million) | 15,973 | 12,024 | +32.8% |
| Robotics — revenue (¥ million) | 118,404 | 119,204 | −0.7% |
| Robotics — segment profit (¥ million) | 5,974 | 10,542 | −43.3% |
| System engineering — revenue (¥ million) | 20,778 | 18,690 | +11.2% |
| System engineering — segment profit (¥ million) | 3,480 | 1,939 | +79.5% |
| Total assets (¥ million) | 842,833 | 812,365 | +3.8% |
| Shareholders' equity (¥ million) | 504,101 | 483,542 | +4.3% |
| Equity ratio | 59.8% | 59.5% | +0.3 pt |
| FY2/2027 guidance — revenue (¥ million) | 600,000 | — | +10.7% |
| FY2/2027 guidance — operating profit (¥ million) | 57,500 | — | +21.5% |
| FY2/2027 guidance — pre-tax profit (¥ million) | 65,500 | — | +32.2% |
| FY2/2027 guidance — net profit (¥ million) | 47,500 | — | +34.8% |
| Annual dividend per share (¥) | 72.00 | 68.00 | +5.9% |
JapanStockPulse provides informational content only and does not constitute investment advice. Figures are taken from the company's published earnings short report and may be subject to subsequent revision.