Higher rates lift revenue and costs
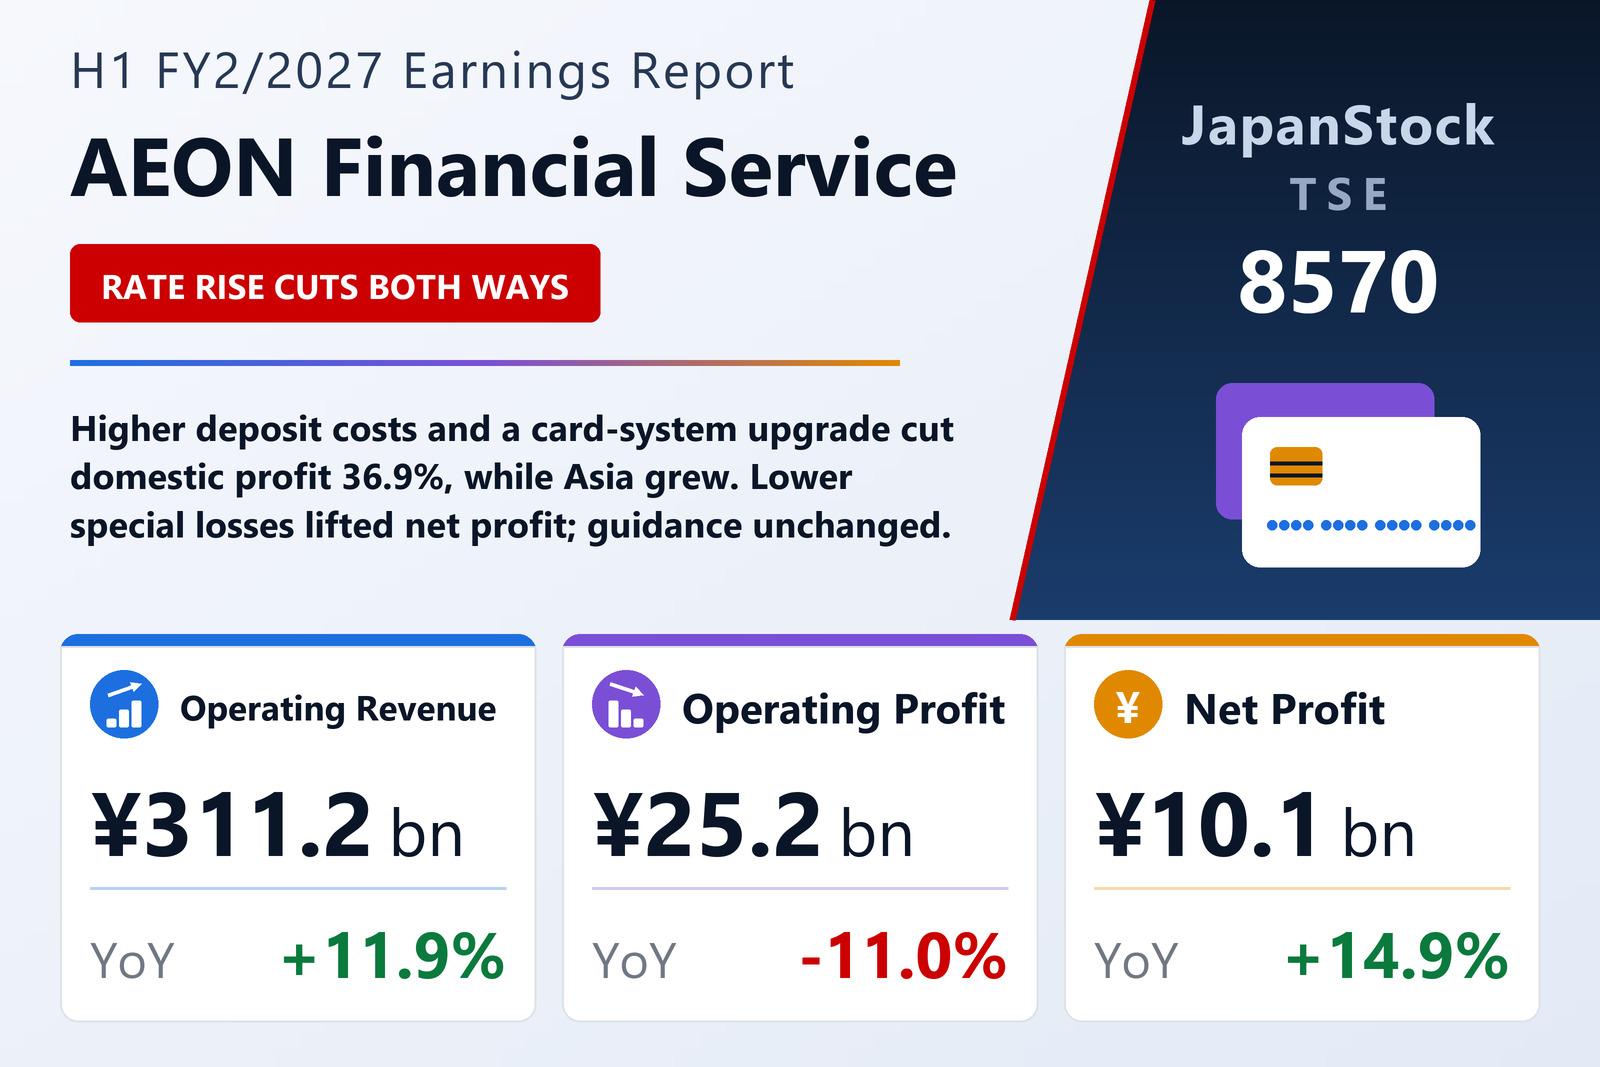
AEON Financial Service Co., Ltd. (TSE: 8570), the financial arm of the AEON retail group, which runs AEON Bank and card, payment and loan businesses in Japan and across Asia, reported consolidated results for the first half of FY2/2027, the six months from March 1 to August 31, 2026, on October 9, 2026 under Japanese GAAP. Operating revenue rose 11.9% to ¥311,202 million, while operating profit fell 11.0% to ¥25,209 million and ordinary profit 11.0% to ¥25,972 million. Net profit attributable to owners of the parent rose 14.9% to ¥10,052 million, or ¥46.56 per share against ¥40.51, as special losses fell to ¥1,151 million from ¥12,542 million a year earlier.
The company said the Bank of Japan's continuing normalization lifted interest on deposits and other funding costs, and the replacement of its core credit-card system, completed in June 2026 and running stably, added one-off expenses. Comprehensive income was a loss of ¥8,316 million, against a ¥9,464 million gain, mainly because unrealized gains on securities fell ¥42,729 million.
Japan squeezed, Asia steady
Domestic operating revenue rose 9.6% to ¥181,253 million, but domestic operating profit fell 36.9% to ¥5,992 million. In retail, a higher shopping-revolving fee and rising loan and securities income lifted revenue while deposit interest cut profit to ¥3,082 million from ¥4,759 million; AEON Bank's deposits fell ¥48,481 million to ¥5.42 trillion as competition for deposits intensified. In solutions, the AEON Pay smartphone payment base grew, but card-system costs cut profit to ¥3,327 million from ¥6,443 million.
Overseas operating revenue rose 14.2% to ¥131,019 million and profit 2.2% to ¥19,167 million. Greater China, centred on Hong Kong, grew profit 20.3% to ¥6,368 million on higher volumes and lower credit costs, and the Malay region, centred on Malaysia, grew revenue 23.0% and profit 14.0% to ¥6,340 million. The Mekong region's profit fell 18.3% to ¥6,458 million as Thai consumption stayed weak and credit costs rose in Cambodia.
Balance sheet and outlook
Total assets were essentially flat at ¥8,314,118 million as installment receivables and loans grew and cash fell. Net assets fell 3.0% to ¥606,692 million, for an equity ratio of 5.5%. The interim dividend is ¥25, and the company still plans an annual ¥53, the same as last year.
The full-year forecast published on April 8 is unchanged: operating revenue of ¥600,000 million (+5.4%), operating profit of ¥45,000 million (−25.8%), ordinary profit of ¥45,000 million (−25.9%) and net profit of ¥15,000 million (−28.9%).
| Metric | H1 FY2/2027 | H1 FY2/2026 | Change |
|---|---|---|---|
| Operating revenue (¥ million) | 311,202 | 278,160 | +11.9% |
| Operating profit (¥ million) | 25,209 | 28,322 | −11.0% |
| Ordinary profit (¥ million) | 25,972 | 29,192 | −11.0% |
| Net profit attrib. to owners of parent (¥ million) | 10,052 | 8,745 | +14.9% |
| EPS (¥) | 46.56 | 40.51 | +14.9% |
| Comprehensive income (¥ million) | −8,316 | 9,464 | profit to loss |
| Domestic total — revenue (¥ million) | 181,253 | 165,375 | +9.6% |
| Domestic total — segment profit (¥ million) | 5,992 | 9,504 | −36.9% |
| Overseas total — revenue (¥ million) | 131,019 | 114,714 | +14.2% |
| Overseas total — segment profit (¥ million) | 19,167 | 18,756 | +2.2% |
| Total assets (¥ million) | 8,314,118 | 8,313,956 | +0.0% |
| Net assets (¥ million) | 606,692 | 625,209 | −3.0% |
| Equity ratio | 5.5% | 5.7% | −0.2 pt |
| FY2/2027 guidance — operating revenue (¥ million) | 600,000 | — | +5.4% |
| FY2/2027 guidance — operating profit (¥ million) | 45,000 | — | −25.8% |
| FY2/2027 guidance — ordinary profit (¥ million) | 45,000 | — | −25.9% |
| FY2/2027 guidance — net profit (¥ million) | 15,000 | — | −28.9% |
| Annual dividend per share (¥) | 53.00 | 53.00 | unchanged |
JapanStockPulse provides informational content only and does not constitute investment advice. Figures are taken from the company's published earnings short report and may be subject to subsequent revision.