Working through a large backlog
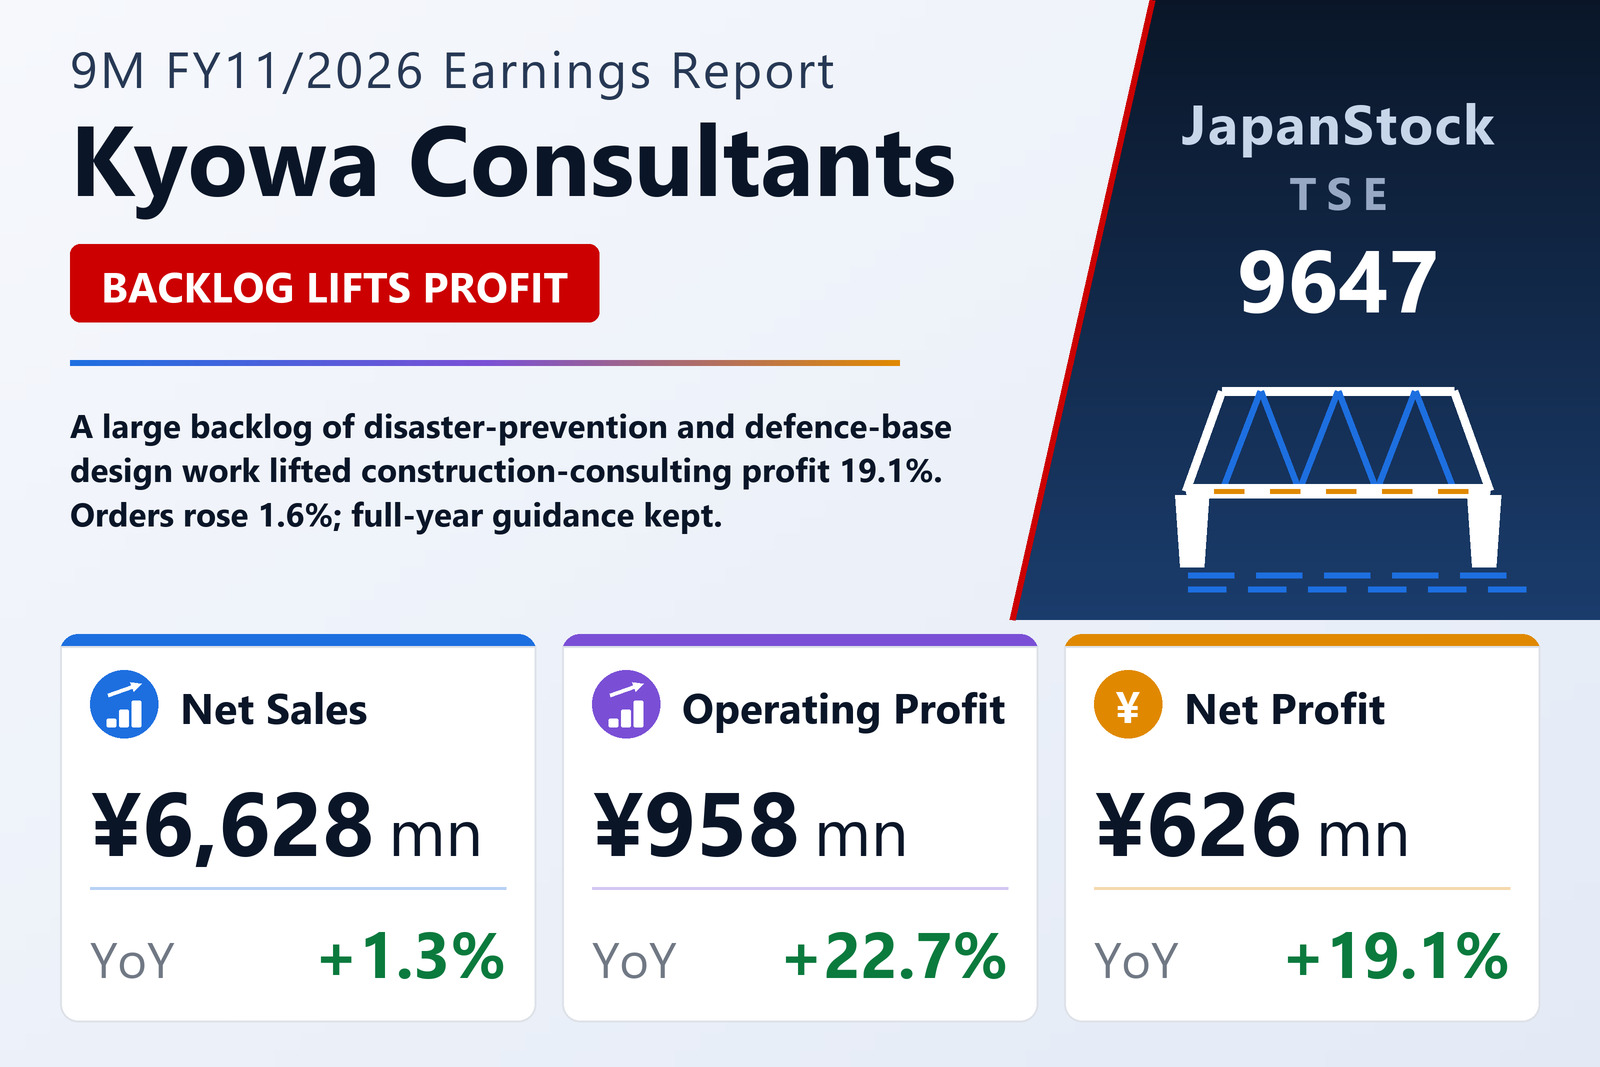
Kyowa Consultants Co., Ltd. (TSE: 9647), a construction consultant that designs and surveys public infrastructure, reported consolidated results for the first nine months of FY11/2026, December 1, 2025 to August 31, 2026, on October 9, 2026 under Japanese GAAP. Net sales rose 1.3% to ¥6,628 million, operating profit 22.7% to ¥958 million and ordinary profit 20.8% to ¥958 million. Net profit attributable to owners of the parent rose 19.1% to ¥626 million, or ¥1,071.09 per share against ¥899.55.
The company said demand for disaster prevention and national resilience work and for base construction under Japan's defence build-up plan kept the order environment favourable. Orders rose 1.6% to ¥7,465 million, and the company said it is on track against the forecast it issued in January 2026.
Segments
In construction consulting, orders rose 0.7% to ¥6,076 million and sales 1.6% to ¥5,536 million, and segment profit rose 19.1% to ¥1,034 million thanks to the ample workload carried over from the previous year. In information processing, orders rose 5.8% to ¥1,386 million and sales were flat at ¥1,089 million, and the segment swung to an operating profit of ¥8 million from a ¥5 million loss as order measures took effect. A small property segment serving group companies earned ¥27 million.
Balance sheet and outlook
Total assets rose 1.8% to ¥8,496 million and net assets 14.2% to ¥5,246 million, lifting the equity ratio to 59.7% from 52.9%. The company plans a year-end dividend of ¥30, unchanged.
The full-year forecast is unchanged: net sales of ¥8,600 million (+1.9%), operating profit of ¥1,030 million (+12.3%), ordinary profit of ¥1,020 million (+10.2%) and net profit of ¥670 million (+9.7%).
| Metric | 9M FY11/2026 | 9M FY11/2025 | Change |
|---|---|---|---|
| Net sales (¥ million) | 6,628 | 6,540 | +1.3% |
| Operating profit (¥ million) | 958 | 781 | +22.7% |
| Ordinary profit (¥ million) | 958 | 793 | +20.8% |
| Net profit attrib. to owners of parent (¥ million) | 626 | 526 | +19.1% |
| EPS (¥) | 1,071.09 | 899.55 | +19.1% |
| Total assets (¥ million) | 8,496 | 8,348 | +1.8% |
| Net assets (¥ million) | 5,246 | 4,592 | +14.2% |
| Equity ratio | 59.7% | 52.9% | +6.8 pt |
| FY11/2026 guidance — revenue (¥ million) | 8,600 | — | +1.9% |
| FY11/2026 guidance — operating profit (¥ million) | 1,030 | — | +12.3% |
| FY11/2026 guidance — ordinary profit (¥ million) | 1,020 | — | +10.2% |
| FY11/2026 guidance — net profit (¥ million) | 670 | — | +9.7% |
| Annual dividend per share (¥) | 30.00 | 30.00 | unchanged |
JapanStockPulse provides informational content only and does not constitute investment advice. Figures are taken from the company's published earnings short report and may be subject to subsequent revision.