Strong first half for the pub chain
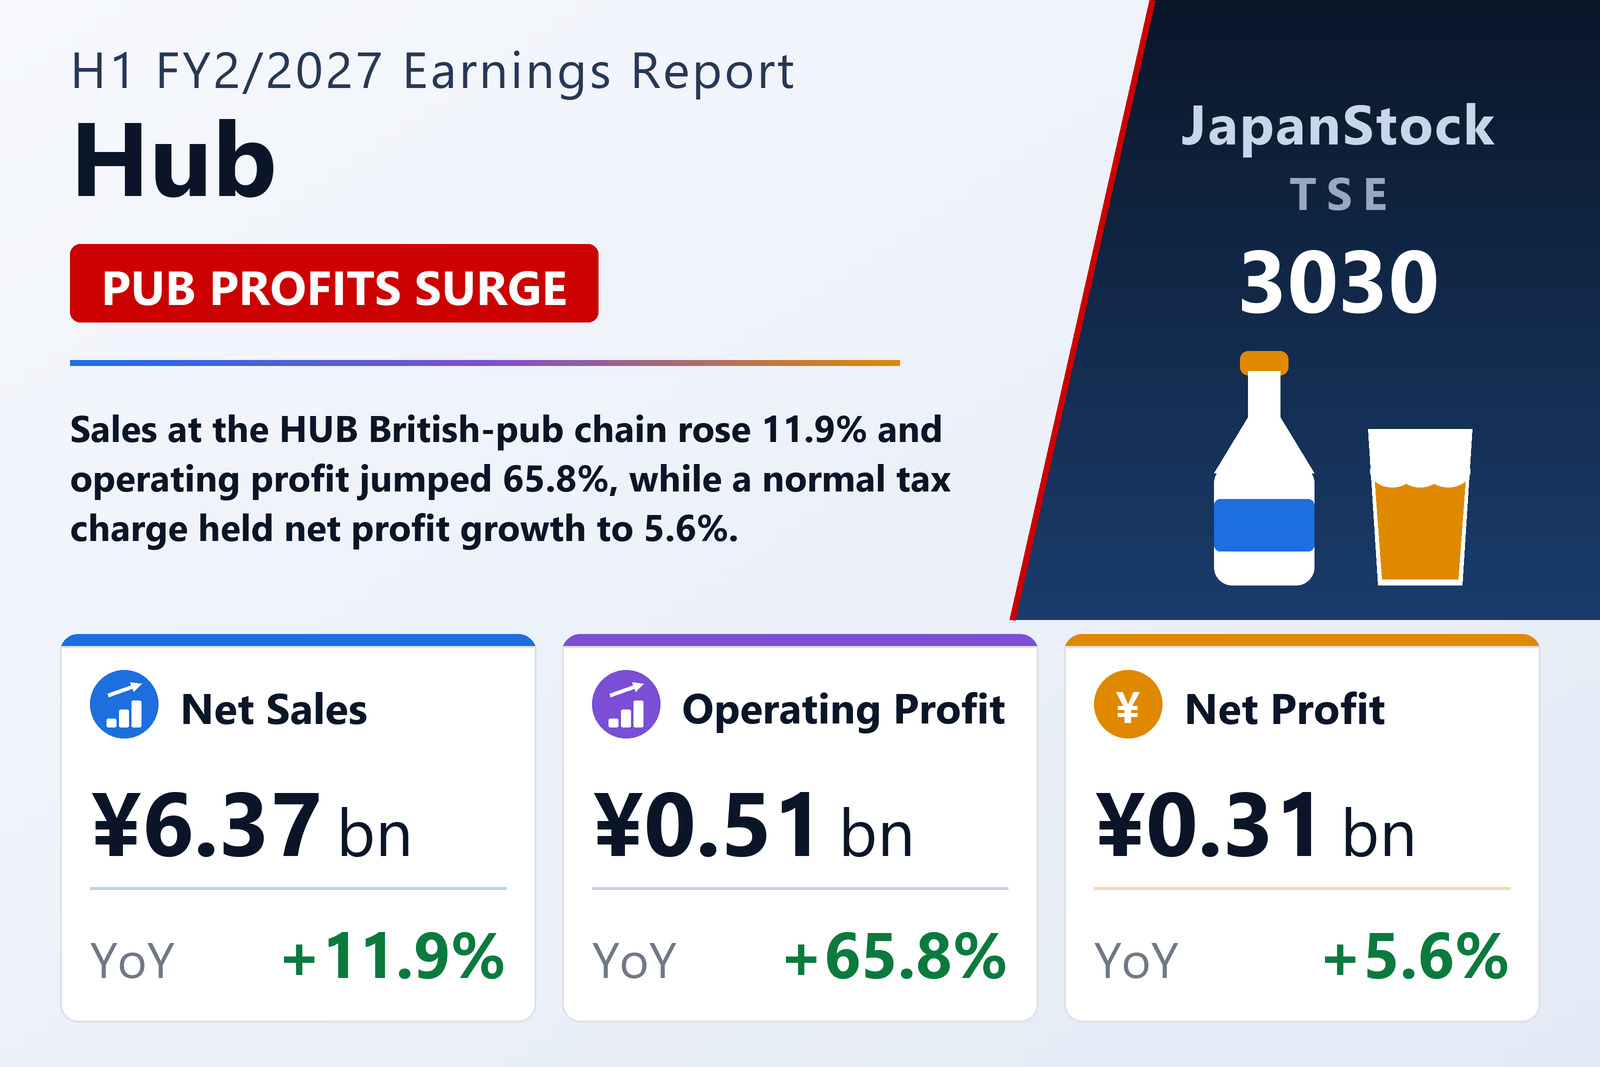
Hub Co., Ltd. (TSE: 3030), which operates the HUB and 82 British-style pubs across Japan, reported non-consolidated results for the first half of FY2/2027, the six months from March 1 to August 31, 2026, on October 14, 2026 under Japanese GAAP. Net sales rose 11.9% to ¥6,368 million, operating profit 65.8% to ¥513 million and ordinary profit 68.5% to ¥510 million. Net profit rose 5.6% to ¥309 million, or ¥24.62 per share against ¥23.31.
Gross profit grew 13.0% to ¥4,513 million, a little faster than sales, putting the gross margin at about 70.9% against 70.2%, while selling, general and administrative expenses rose a slower 8.8% to ¥4,060 million. Corporate taxes came to ¥200 million, against less than ¥10 million in the same half last year, which is why the bottom line grew far more slowly than operating profit.
Balance sheet and cash flow
Total assets rose 7.6% to ¥7,156 million from the end of February and net assets 5.4% to ¥3,592 million, for an equity ratio of 49.5%, down from 50.7%. Operating cash flow was ¥583 million, up from ¥356 million, investing activities used ¥266 million, mainly for store fixtures, and the company took on ¥300 million of long-term borrowings. Cash and equivalents ended the half at ¥2,893 million.
Outlook and dividend
The company kept its full-year forecast of net sales of ¥12,000 million (+5.9%), operating profit of ¥600 million (+12.3%), ordinary profit of ¥580 million (+9.8%) and net profit of ¥330 million (−45.9%). First-half operating profit already amounts to about 86% of the full-year target. The planned year-end dividend is ¥10, against last year's ¥11, which included a ¥1 special dividend.
| Metric | H1 FY2/2027 | H1 FY2/2026 | Change |
|---|---|---|---|
| Net sales (¥ million) | 6,368 | 5,689 | +11.9% |
| Gross profit (¥ million) | 4,513 | 3,992 | +13.0% |
| SG&A expenses (¥ million) | 4,060 | 3,730 | +8.8% |
| Operating profit (¥ million) | 513 | 309 | +65.8% |
| Ordinary profit (¥ million) | 510 | 302 | +68.5% |
| Net profit (¥ million) | 309 | 293 | +5.6% |
| EPS (¥) | 24.62 | 23.31 | +5.6% |
| Total assets (¥ million) | 7,156 | 6,653 | +7.6% |
| Net assets (¥ million) | 3,592 | 3,407 | +5.4% |
| Equity ratio | 49.5% | 50.7% | −1.2 pt |
| FY2/2027 guidance — revenue (¥ million) | 12,000 | — | +5.9% |
| FY2/2027 guidance — operating profit (¥ million) | 600 | — | +12.3% |
| FY2/2027 guidance — ordinary profit (¥ million) | 580 | — | +9.8% |
| FY2/2027 guidance — net profit (¥ million) | 330 | — | −45.9% |
| Annual dividend per share (¥) | 10.00 | 11.00 | −9.1% |
JapanStockPulse provides informational content only and does not constitute investment advice. Figures are taken from the company's published earnings short report and may be subject to subsequent revision.