Sales up, profit down
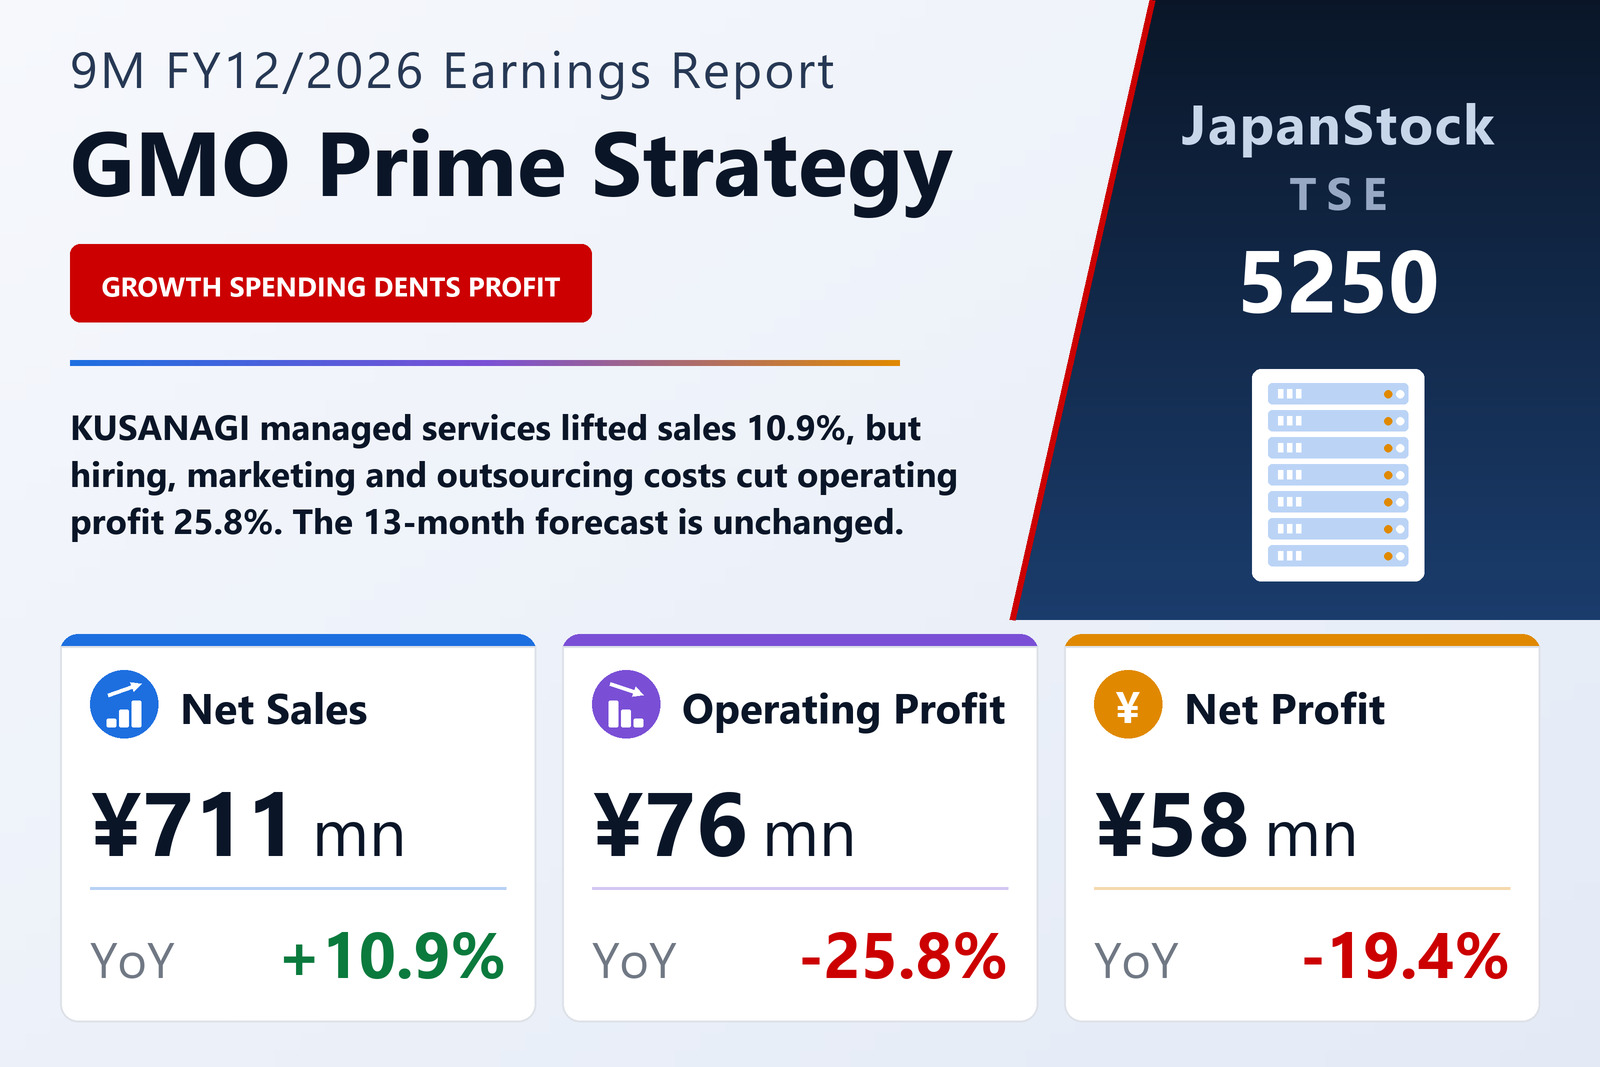
GMO Prime Strategy Co., Ltd. (TSE: 5250) reported consolidated results for the first nine months of FY12/2026, from December 1, 2025 to August 31, 2026, on October 14, 2026 under Japanese GAAP. The company has moved its year-end from November to December, so FY12/2026 is a 13-month transitional year. Net sales rose 10.9% to ¥711 million, but operating profit fell 25.8% to ¥76 million and ordinary profit 22.5% to ¥80 million. Net profit attributable to owners of the parent declined 19.4% to ¥58 million, or ¥16.64 per share against ¥20.68.
Growth came mainly from KUSANAGI Managed Service by GMO, which handles the maintenance and operation of corporate websites end to end, alongside sales of paid KUSANAGI licences. Profit fell because the company spent ahead of time on hiring, sales capacity and marketing, and because outsourcing and personnel costs rose.
Joining GMO and a new AI business
The company joined GMO Internet Group on December 26, 2025, and expects the tie-up to combine both groups' technology to strengthen clients' digital infrastructure and support AI-driven efficiency. From the first half it has run a second business, AI, offering an automated grading service for educational institutions, GMO AI RAG and GMO AI RAG Chat. The AI business is not yet material, so segment figures are not disclosed.
Balance sheet
Total assets fell 3.9% to ¥1,543 million from November 30, 2025, mainly because cash and deposits declined by ¥129 million after the dividend payment. Net assets edged down 0.9% to ¥1,409 million, and with liabilities also lower the equity ratio rose to 91.4% from 88.5%.
Outlook and dividend
The forecast for the 13-month FY12/2026, revised on April 13 when the change of year-end was announced, is unchanged: net sales of ¥1,124 million, operating profit of ¥70 million, ordinary profit of ¥72 million and net profit of ¥51 million. No year-on-year comparison is given because the period is longer than a normal year. The company plans a year-end dividend of ¥22, the same as for FY11/2025.
| Metric | 9M FY12/2026 | 9M FY11/2025 | Change |
|---|---|---|---|
| Net sales (¥ million) | 711 | 641 | +10.9% |
| Operating profit (¥ million) | 76 | 102 | −25.8% |
| Ordinary profit (¥ million) | 80 | 103 | −22.5% |
| Net profit attrib. to owners of parent (¥ million) | 58 | 72 | −19.4% |
| EPS (¥) | 16.64 | 20.68 | −19.5% |
| Comprehensive income (¥ million) | 60 | 71 | −16.1% |
| Total assets (¥ million) | 1,543 | 1,606 | −3.9% |
| Net assets (¥ million) | 1,409 | 1,422 | −0.9% |
| Equity ratio | 91.4% | 88.5% | +2.9 pt |
| FY12/2026 guidance — revenue (¥ million) | 1,124 | — | n.m. |
| FY12/2026 guidance — operating profit (¥ million) | 70 | — | n.m. |
| FY12/2026 guidance — ordinary profit (¥ million) | 72 | — | n.m. |
| FY12/2026 guidance — net profit (¥ million) | 51 | — | n.m. |
| Annual dividend per share (¥) | 22.00 | 22.00 | unchanged |
JapanStockPulse provides informational content only and does not constitute investment advice. Figures are taken from the company's published earnings short report and may be subject to subsequent revision.