Records across the board
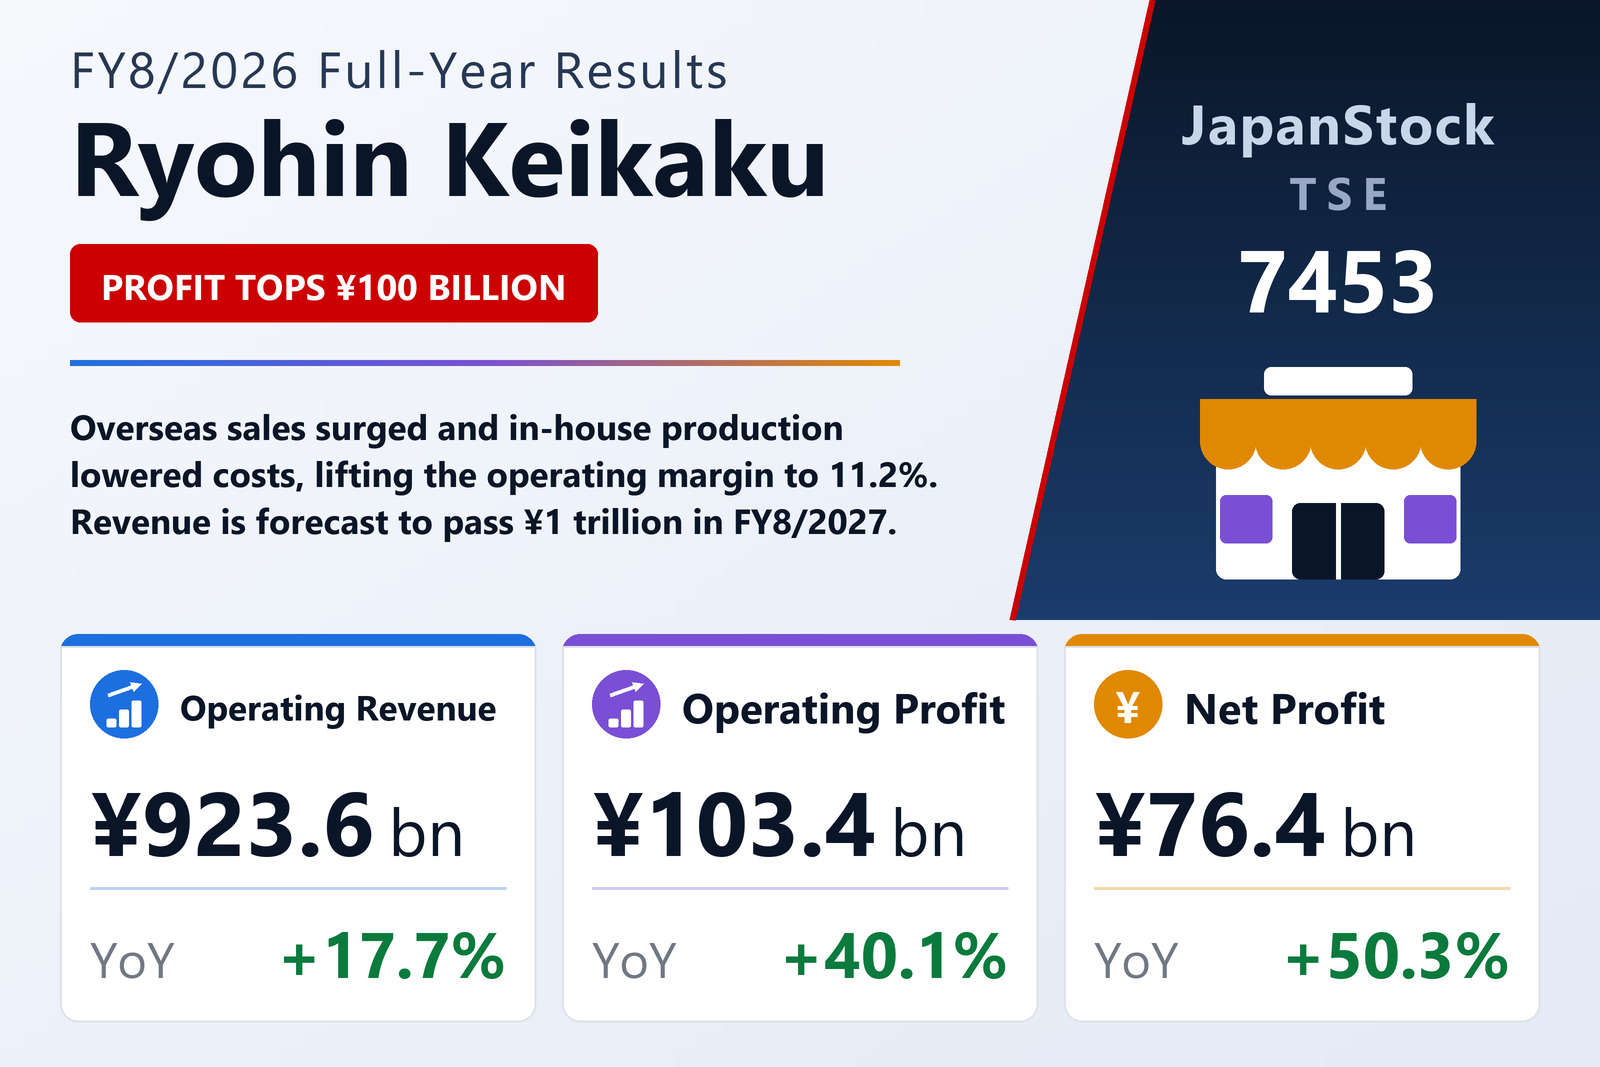
Ryohin Keikaku Co., Ltd. (TSE: 7453) reported consolidated results for FY8/2026, the twelve months from September 1, 2025 to August 31, 2026, on October 14, 2026 under Japanese GAAP. Operating revenue rose 17.7% to ¥923,592 million, operating profit 40.1% to ¥103,436 million and ordinary profit 44.8% to ¥104,670 million, all records. The operating margin widened to 11.2% from 9.4%, helped by lower costs from bringing production in-house and fewer markdowns. Net profit attributable to owners of the parent jumped 50.3% to ¥76,422 million, also lifted by foreign-exchange gains, the sale of cross-held shares and deferred tax assets booked at an overseas subsidiary. Earnings per share were ¥143.98 against ¥95.92, restated for a two-for-one share split on September 1, 2025.
MUJI stores, including licensed stores, numbered 1,486 at year-end. In Japan the company opened 50 stores, mainly in suburban areas, and closed 10, for 723; overseas it opened 71 and closed 37, mostly in East Asia and Southeast Asia and Oceania, for 763, and it resumed opening stores in North America.
East Asia closes in on Japan
In Japan, operating revenue rose 8.7% to ¥510,993 million and segment profit 21.6% to ¥63,390 million, helped by new stores and seasonal promotions such as MUJI Week. Same-store sales grew, though online sales were lower after a system failure in the first half. East Asia grew revenue 32.2% to ¥293,783 million and profit 44.2% to ¥61,690 million, almost matching Japan, as sales rose in every category in mainland China and Taiwan, Hong Kong and South Korea also grew. Southeast Asia and Oceania increased revenue 32.8% to ¥66,519 million and profit 64.1% to ¥9,163 million, with flagship openings in Thailand and Vietnam, while Europe and the Americas grew revenue 24.1% to ¥52,295 million and profit 17.0% to ¥8,097 million despite costs ahead of a European flagship due to open in FY8/2027.
Balance sheet and cash flow
Total assets rose 19.5% to ¥672,299 million, mainly on higher cash, inventories and property, and net assets 24.8% to ¥419,265 million, lifting the equity ratio to 61.1% from 59.0%. Operating cash flow came to ¥99,396 million, against ¥73,355 million a year earlier. Investing activities used ¥30,124 million and financing activities ¥43,771 million, including loan and lease repayments and ¥16,654 million of dividends. Cash and equivalents ended the year at ¥169,188 million.
Outlook and dividend
For FY8/2027 the company forecasts operating revenue of ¥1,014,000 million (+9.8%) and operating profit of ¥114,000 million (+10.2%), a fourth straight year of records for both, with ordinary profit of ¥111,000 million (+6.0%). Net profit is expected to fall 4.5% to ¥73,000 million as this year's one-off gains do not recur. The annual dividend was raised to ¥38 from the ¥32 previously planned, equal to ¥25 last year on a post-split basis, and the company plans the same ¥38 for FY8/2027.
| Metric | FY8/2026 | FY8/2025 | Change |
|---|---|---|---|
| Operating revenue (¥ million) | 923,592 | 784,629 | +17.7% |
| Operating profit (¥ million) | 103,436 | 73,840 | +40.1% |
| Operating margin | 11.2% | 9.4% | +1.8 pt |
| Ordinary profit (¥ million) | 104,670 | 72,301 | +44.8% |
| Net profit attrib. to owners of parent (¥ million) | 76,422 | 50,846 | +50.3% |
| EPS (¥) | 143.98 | 95.92 | +50.1% |
| Comprehensive income (¥ million) | 96,515 | 49,066 | +96.7% |
| Japan — revenue (¥ million) | 510,993 | 470,143 | +8.7% |
| Japan — segment profit (¥ million) | 63,390 | 52,111 | +21.6% |
| East Asia — revenue (¥ million) | 293,783 | 222,247 | +32.2% |
| East Asia — segment profit (¥ million) | 61,690 | 42,794 | +44.2% |
| Southeast Asia & Oceania — revenue (¥ million) | 66,519 | 50,105 | +32.8% |
| Southeast Asia & Oceania — segment profit (¥ million) | 9,163 | 5,584 | +64.1% |
| Europe & Americas — revenue (¥ million) | 52,295 | 42,133 | +24.1% |
| Europe & Americas — segment profit (¥ million) | 8,097 | 6,922 | +17.0% |
| Total assets (¥ million) | 672,299 | 562,749 | +19.5% |
| Net assets (¥ million) | 419,265 | 335,920 | +24.8% |
| Equity ratio | 61.1% | 59.0% | +2.1 pt |
| FY8/2027 guidance — operating revenue (¥ million) | 1,014,000 | — | +9.8% |
| FY8/2027 guidance — operating profit (¥ million) | 114,000 | — | +10.2% |
| FY8/2027 guidance — ordinary profit (¥ million) | 111,000 | — | +6.0% |
| FY8/2027 guidance — net profit (¥ million) | 73,000 | — | −4.5% |
| Annual dividend per share (¥) | 38.00 | 25.00 | +52.0% |
JapanStockPulse provides informational content only and does not constitute investment advice. Figures are taken from the company's published earnings short report and may be subject to subsequent revision.