Big stores drive volume
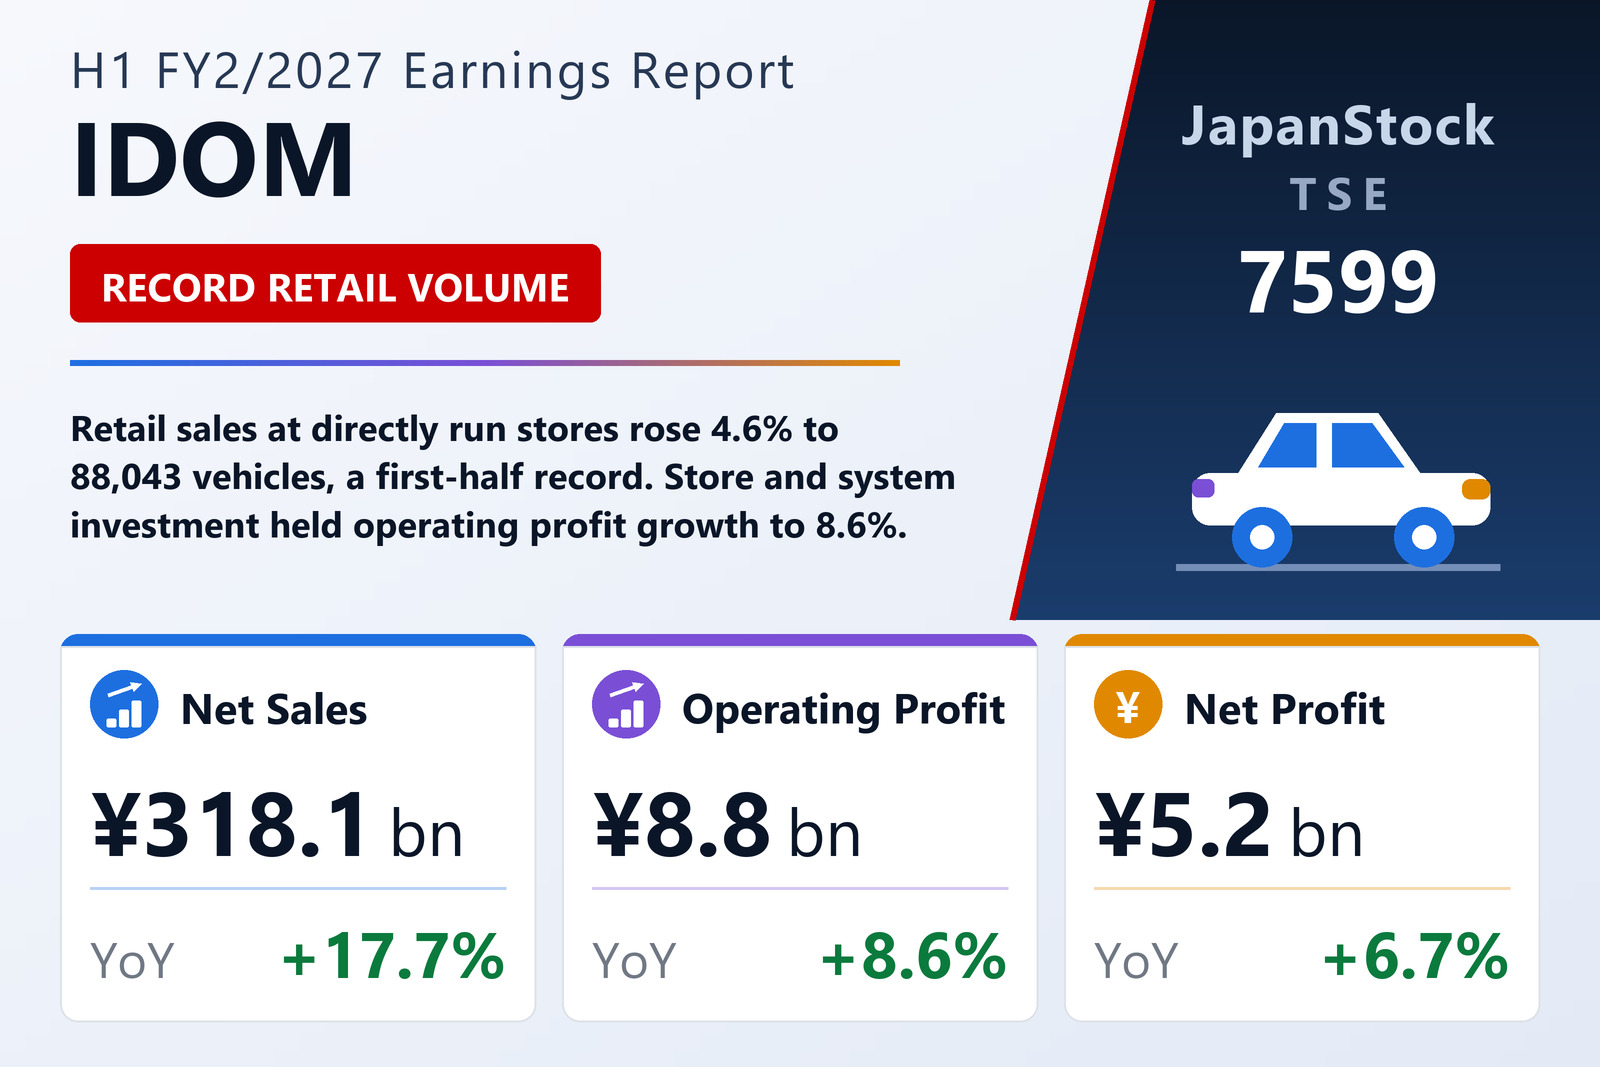
IDOM Inc. (TSE: 7599) reported consolidated results for the first half of FY2/2027, from March 1 to August 31, 2026, on October 14, 2026 under Japanese GAAP. Net sales rose 17.7% to ¥318,100 million, operating profit 8.6% to ¥8,771 million and ordinary profit 5.2% to ¥7,722 million, held back by higher interest expense. Net profit attributable to owners of the parent increased 6.7% to ¥5,201 million, or ¥51.80 per share against ¥48.55. From this year the company changed its revenue-recognition policy, and the prior-year figures have been restated to match.
Retail sales at directly operated stores in Japan rose 4.6% to 88,043 vehicles, a record for a first half, driven by large stores opened in earlier years and steady traffic at existing large outlets. Gross profit rose 17.1% to ¥51,991 million: the company cleared slow-moving stock in the first quarter, which cut the margin per wholesale vehicle, but the margin per retail vehicle improved sharply. Selling, general and administrative expenses grew 18.9% to ¥43,219 million on rent and depreciation for large stores, staff hired ahead of second-half openings, CRM and AI system development, and higher bad-debt provisions as its in-house auto loans grew.
Japan and overseas
In Japan, sales rose 17.1% to ¥311,867 million and segment profit 7.8% to ¥8,765 million. The Other segment, which includes the U.S. business, grew sales 54.9% to ¥6,232 million and turned a profit of ¥12 million after a loss of ¥111 million a year earlier.
Balance sheet
Total assets rose 7.0% to ¥278,983 million from February 28, 2026, as cash increased by ¥6,084 million and vehicles held as fixed assets by ¥5,618 million, while inventory fell by ¥3,149 million. Long-term borrowings rose by ¥9,777 million and short-term borrowings fell by ¥6,778 million. Net assets increased 3.7% to ¥93,651 million, and the equity ratio was 32.9%, against 34.0%.
Outlook and dividend
IDOM revised the FY2/2027 forecast it published on April 13. It now expects net sales of ¥655,000 million (+17.1%), operating profit of ¥18,501 million (−6.2%), ordinary profit of ¥16,422 million (−9.3%) and net profit of ¥10,501 million (−9.3%). It paid an interim dividend of ¥15.54 and revised its year-end forecast to ¥15.84, for an annual ¥31.38, against ¥35.60 for FY2/2026.
| Metric | H1 FY2/2027 | H1 FY2/2026 | Change |
|---|---|---|---|
| Net sales (¥ million) | 318,100 | 270,298 | +17.7% |
| Gross profit (¥ million) | 51,991 | 44,416 | +17.1% |
| SG&A expenses (¥ million) | 43,219 | 36,338 | +18.9% |
| Operating profit (¥ million) | 8,771 | 8,078 | +8.6% |
| Ordinary profit (¥ million) | 7,722 | 7,339 | +5.2% |
| Net profit attrib. to owners of parent (¥ million) | 5,201 | 4,875 | +6.7% |
| EPS (¥) | 51.80 | 48.55 | +6.7% |
| Comprehensive income (¥ million) | 5,359 | 4,892 | +9.6% |
| Japan — revenue (¥ million) | 311,867 | 266,281 | +17.1% |
| Japan — segment profit (¥ million) | 8,765 | 8,129 | +7.8% |
| Other — revenue (¥ million) | 6,232 | 4,023 | +54.9% |
| Other — segment profit (¥ million) | 12 | −111 | loss to profit |
| Total assets (¥ million) | 278,983 | 260,825 | +7.0% |
| Net assets (¥ million) | 93,651 | 90,316 | +3.7% |
| Equity ratio | 32.9% | 34.0% | −1.1 pt |
| FY2/2027 guidance — revenue (¥ million) | 655,000 | — | +17.1% |
| FY2/2027 guidance — operating profit (¥ million) | 18,501 | — | −6.2% |
| FY2/2027 guidance — ordinary profit (¥ million) | 16,422 | — | −9.3% |
| FY2/2027 guidance — net profit (¥ million) | 10,501 | — | −9.3% |
| Annual dividend per share (¥) | 31.38 | 35.60 | −11.9% |
JapanStockPulse provides informational content only and does not constitute investment advice. Figures are taken from the company's published earnings short report and may be subject to subsequent revision.