Losses widen as sales hold flat
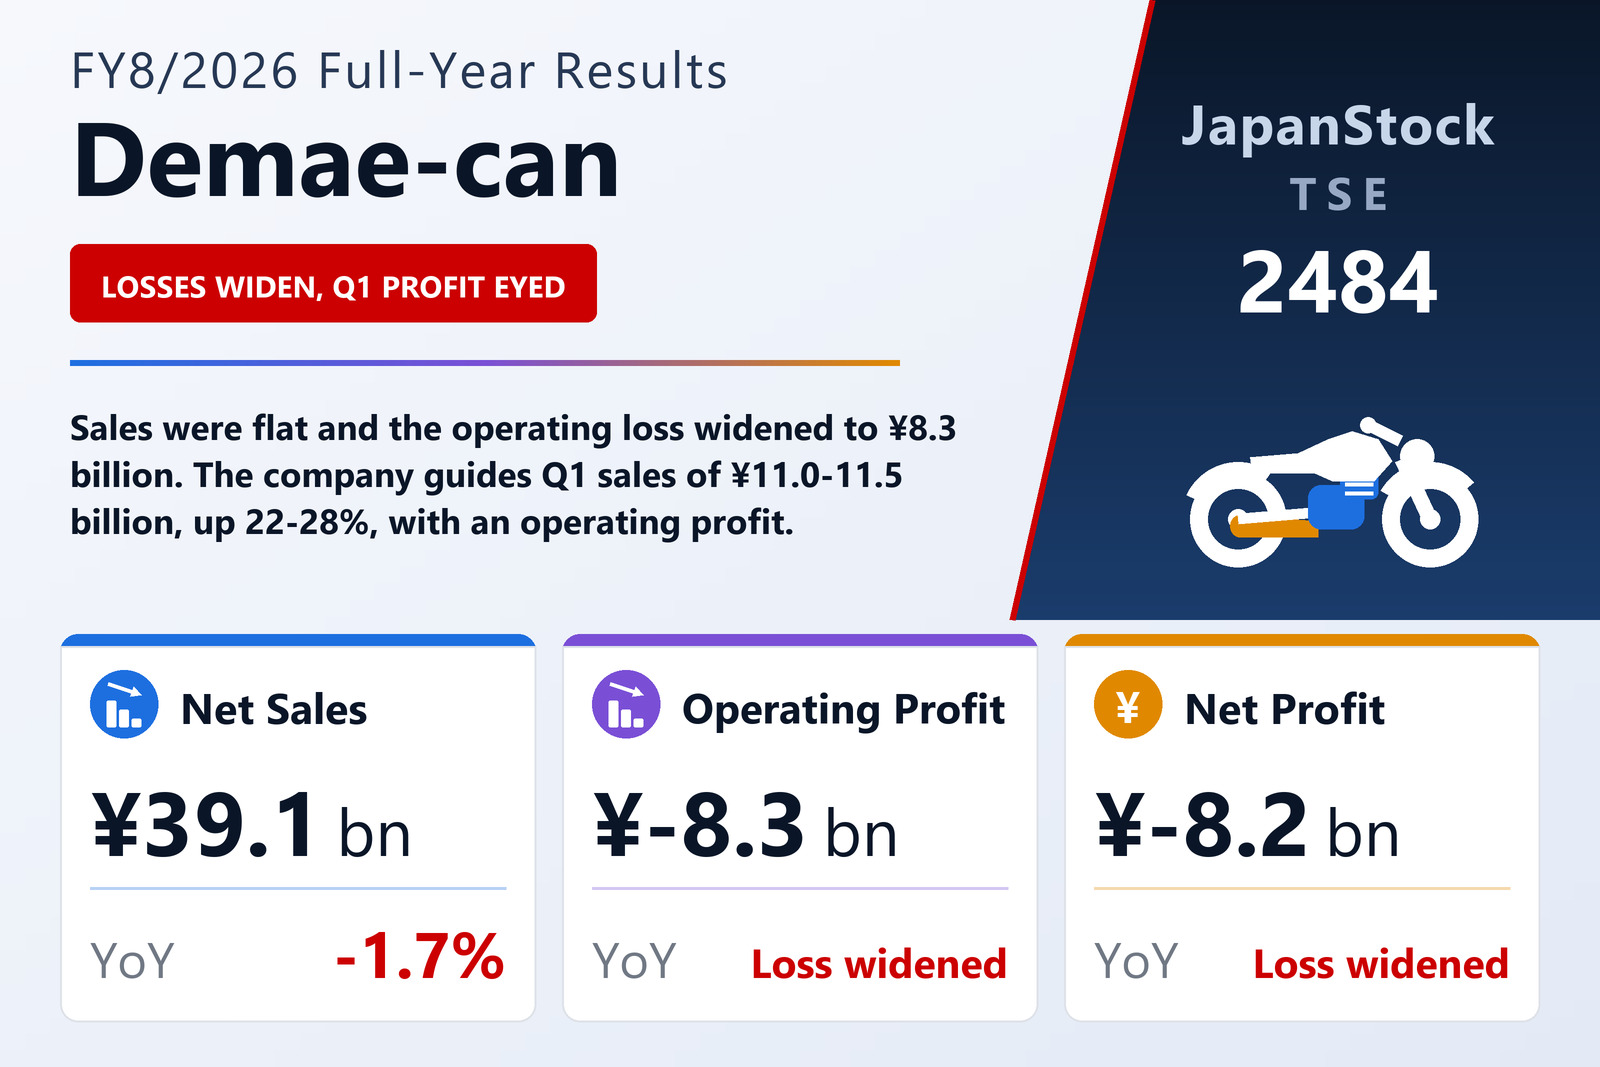
Demae-can Co., Ltd. (TSE: 2484), the Tokyo-based operator of the Demae-can food-delivery platform, reported consolidated results for FY8/2026, the year from September 1, 2025 to August 31, 2026, on October 15, 2026 under Japanese GAAP. Net sales slipped 1.7% to ¥39,057 million, the operating loss widened to ¥8,288 million from ¥4,923 million and the ordinary loss to ¥8,235 million from ¥4,968 million. The net loss attributable to owners of the parent was ¥8,246 million, or ¥74.02 per share, against ¥4,971 million.
The company said it worked to grow the food-delivery market and its own competitiveness by expanding its line-up of partner restaurants, making delivery times more accurate and improving delivery and customer-service quality, aiming to raise satisfaction among users, couriers and merchants. Demae-can reports a single segment.
Balance sheet and outlook
Total assets fell 19.6% to ¥31,221 million as cash and deposits dropped ¥8,902 million, and net assets fell 28.6% to ¥20,431 million on the year's loss, for an equity ratio of 65.3%, down from 73.7%. Operating cash flow was an outflow of ¥8,922 million, and cash and cash equivalents ended August at ¥19,633 million. The company paid no dividend and plans none for FY8/2027.
Because the food-delivery business can change sharply in a short time, Demae-can discloses quarterly forecasts instead of a full-year one. For the first quarter of FY8/2027, September to November 2026, it expects net sales of ¥11,000-11,500 million, 22-28% above a year earlier, and an operating profit.
| Metric | FY8/2026 | FY8/2025 | Change |
|---|---|---|---|
| Net sales (¥ million) | 39,057 | 39,721 | −1.7% |
| Operating profit (¥ million) | −8,288 | −4,923 | loss widened |
| Ordinary profit (¥ million) | −8,235 | −4,968 | loss widened |
| Net profit attrib. to owners of parent (¥ million) | −8,246 | −4,971 | loss widened |
| EPS (¥) | −74.02 | −43.62 | loss widened |
| Total assets (¥ million) | 31,221 | 38,848 | −19.6% |
| Net assets (¥ million) | 20,431 | 28,625 | −28.6% |
| Equity ratio | 65.3% | 73.7% | −8.4 pt |
JapanStockPulse provides informational content only and does not constitute investment advice. Figures are taken from the company's published earnings short report and may be subject to subsequent revision.