Balance-sheet deals drive the year
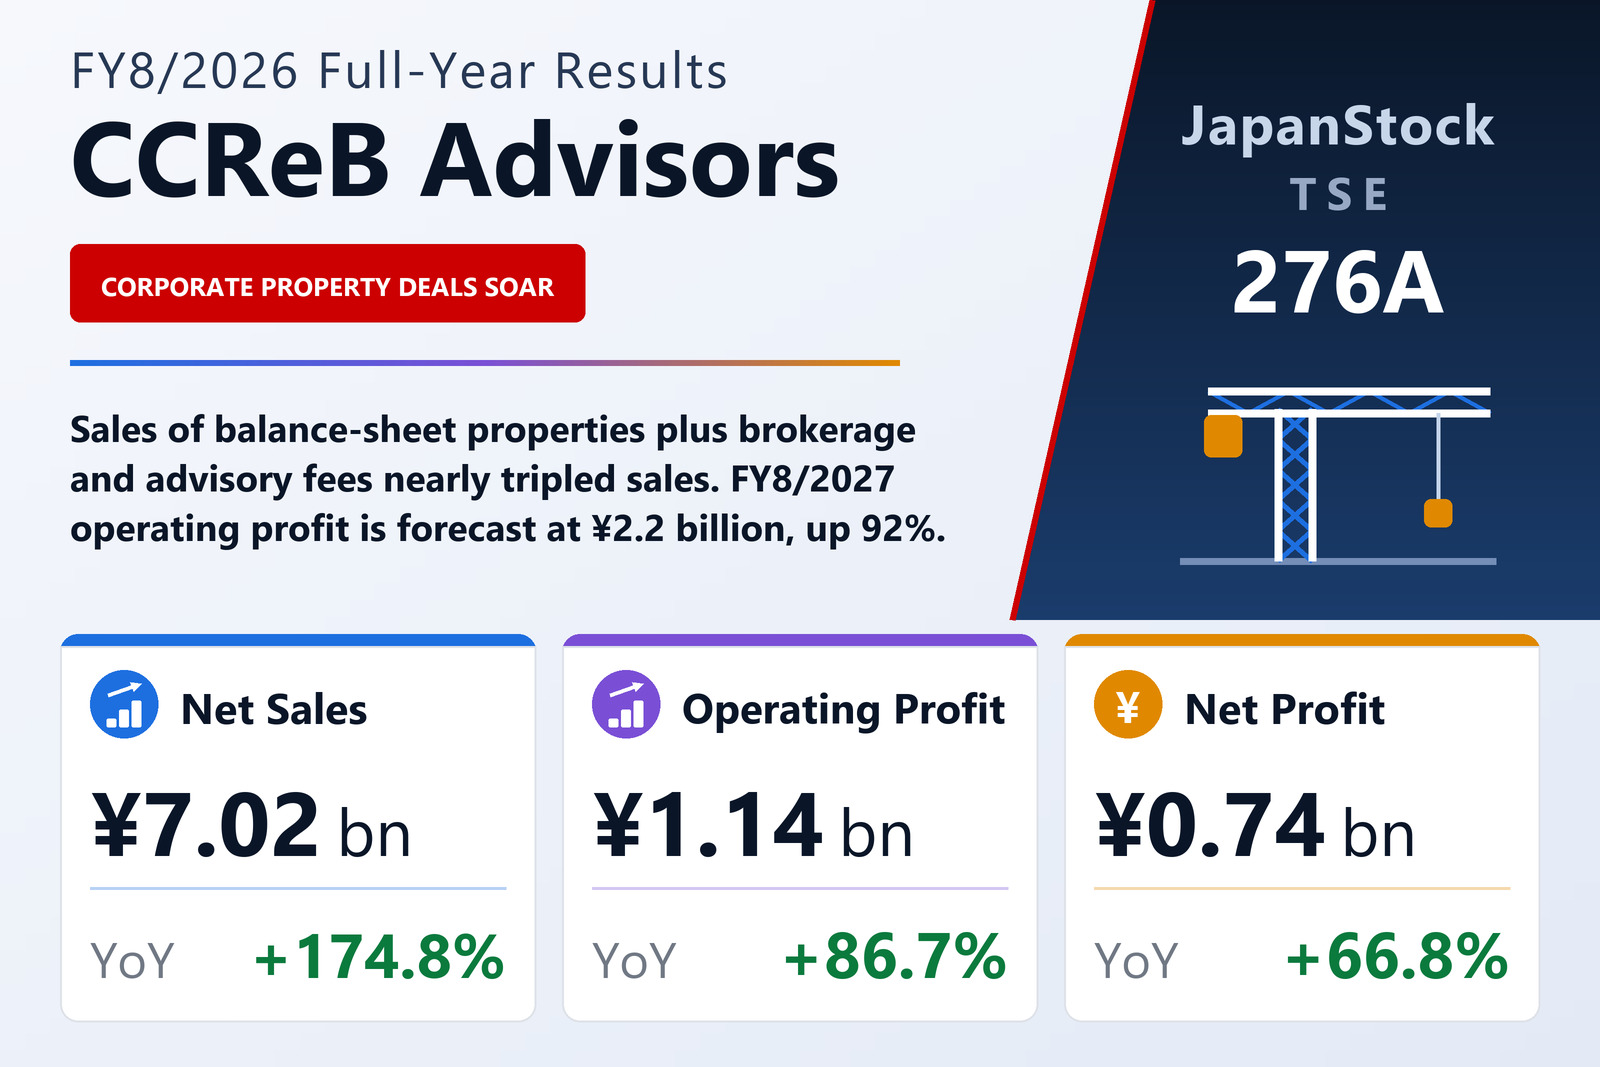
CCReB Advisors Inc. (TSE: 276A), the Tokyo-based firm that provides solutions for companies' real estate, focusing on factories, research and logistics sites worth ¥2 billion or less, reported consolidated results for FY8/2026, the year from September 1, 2025 to August 31, 2026, on October 15, 2026 under Japanese GAAP. Net sales rose 174.8% to ¥7,020 million, operating profit 86.7% to ¥1,144 million and ordinary profit 76.7% to ¥1,057 million. Net profit attributable to owners of the parent rose 66.8% to ¥743 million, or ¥151.86 per share against ¥110.46. The company said it met every sales and profit target in the first year of its medium-term plan.
Corporate real-estate solutions sales rose 186.2% to ¥6,824 million, including the sale of property held for sale under its balance-sheet investment model, brokerage deals found through its matching system and advisory mandates; real-estate tech sales rose 15.0% to ¥197 million. Recurring 'stock' income was ¥696 million, 9.9% of sales, and transaction-based 'flow' income ¥6,324 million. Registrations on the matching system, a key indicator, rose 30.2% to 8,941.
Balance sheet, dividend and outlook
Total assets rose 91.8% to ¥7,270 million and net assets 153.1% to ¥5,302 million, helped by a public offering and third-party allotment of new shares that lifted both capital and capital reserve by ¥1,279 million, for an equity ratio of 72.9%. The annual dividend is ¥30, against ¥22, and the company plans ¥50 for FY8/2027.
For FY8/2027 it forecasts net sales of ¥11,000 million (+56.7%), operating profit of ¥2,200 million (+92.2%), ordinary profit of ¥2,000 million (+89.1%) and net profit of ¥1,400 million (+88.4%). Its medium-term plan targets sales of ¥12,000 million in FY2028.
| Metric | FY8/2026 | FY8/2025 | Change |
|---|---|---|---|
| Net sales (¥ million) | 7,020 | 2,555 | +174.8% |
| Operating profit (¥ million) | 1,144 | 612 | +86.7% |
| Ordinary profit (¥ million) | 1,057 | 598 | +76.7% |
| Net profit attrib. to owners of parent (¥ million) | 743 | 445 | +66.8% |
| EPS (¥) | 151.86 | 110.46 | +37.5% |
| Total assets (¥ million) | 7,270 | 3,791 | +91.8% |
| Net assets (¥ million) | 5,302 | 2,095 | +153.1% |
| Equity ratio | 72.9% | 55.2% | +17.7 pt |
| FY8/2027 guidance — revenue (¥ million) | 11,000 | — | +56.7% |
| FY8/2027 guidance — operating profit (¥ million) | 2,200 | — | +92.2% |
| FY8/2027 guidance — ordinary profit (¥ million) | 2,000 | — | +89.1% |
| FY8/2027 guidance — net profit (¥ million) | 1,400 | — | +88.4% |
| Annual dividend per share (¥) | 30.00 | 22.00 | +36.4% |
JapanStockPulse provides informational content only and does not constitute investment advice. Figures are taken from the company's published earnings short report and may be subject to subsequent revision.