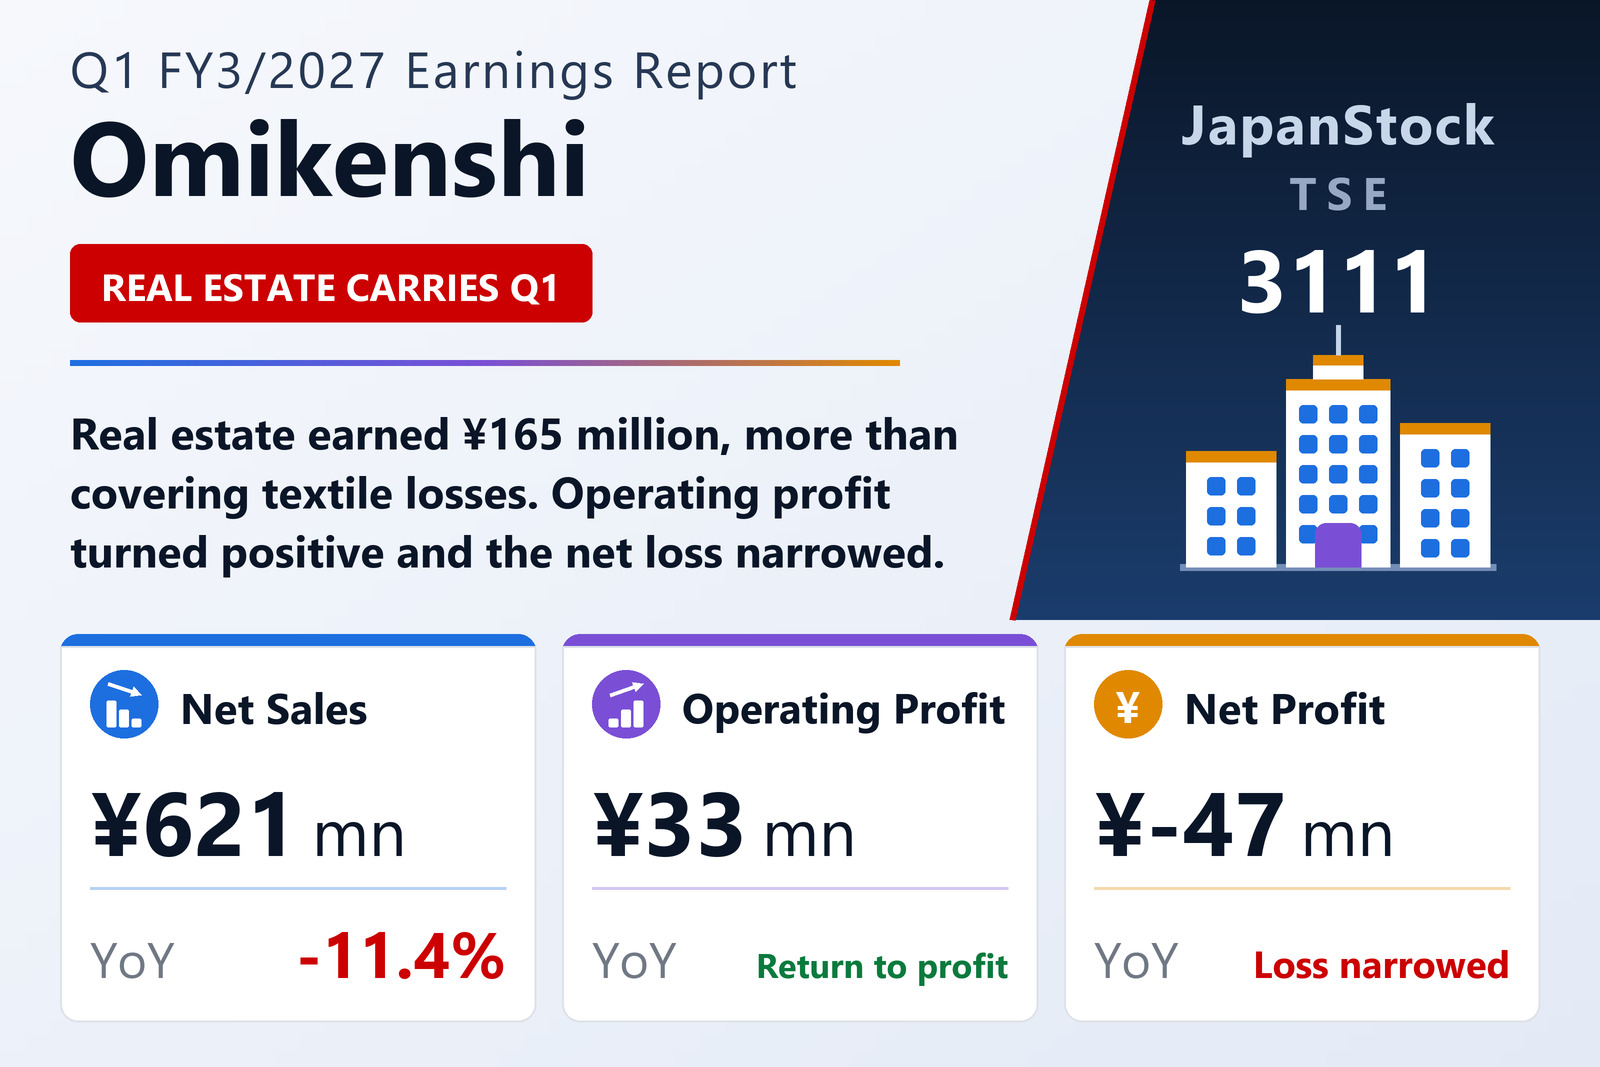
Real estate carries the quarter
Omikenshi Co., Ltd. (TSE: 3111) reported consolidated results for the first quarter of FY3/2027, from April 1 to June 30, 2026, on October 22, 2026 under Japanese GAAP. Net sales fell 11.4% to ¥621 million, but the company posted operating profit of ¥33 million against a loss of ¥13 million a year earlier. The ordinary loss narrowed to ¥17 million from ¥81 million, and after a ¥28 million loss on business withdrawal the net loss attributable to owners of the parent narrowed to ¥47 million from ¥101 million, or ¥8.48 per share against ¥16.49.
Segments
Textile sales fell 13.6% to ¥318 million and the segment loss narrowed to ¥30 million from ¥43 million. Real estate sales rose 0.7% to ¥263 million and segment profit 0.2% to ¥165 million, more than covering the losses elsewhere. From this quarter the former Food segment, which the company is exiting, is reported within Other, and the prior-year figures have been restated. Other, which also includes software development and sales, saw sales fall 44.5% to ¥39 million and its loss narrow to ¥5 million from ¥20 million. Corporate costs not allocated to the segments were ¥102 million.
Thin equity
Total assets fell by ¥202 million from March 31 to ¥14,980 million, mainly on lower current assets; land accounts for ¥12,580 million of the total. Liabilities fell by ¥149 million to ¥13,597 million. Net assets declined to ¥1,382 million, and the equity ratio was 9.2%, against 9.5%.
Outlook and dividend
The full-year forecast published on August 7 was left unchanged: net sales of ¥3,200 million (+10.7%), operating profit of ¥280 million, ordinary profit of ¥110 million and net profit of ¥210 million, or ¥26.76 per share; no percentage change is given for the three profit lines. The year-end dividend remains undecided, and the company paid no dividend on its common shares for FY3/2026.
| Metric | Q1 FY3/2027 | Q1 FY3/2026 | Change |
|---|---|---|---|
| Net sales (¥ million) | 621 | 702 | −11.4% |
| Operating profit (¥ million) | 33 | −13 | loss to profit |
| Ordinary profit (¥ million) | −17 | −81 | loss narrowed |
| Net profit attrib. to owners of parent (¥ million) | −47 | −101 | loss narrowed |
| EPS (¥) | −8.48 | −16.49 | loss narrowed |
| Textiles — revenue (¥ million) | 318 | 368 | −13.6% |
| Textiles — segment profit (¥ million) | −30 | −43 | loss narrowed |
| Real estate — revenue (¥ million) | 263 | 261 | +0.7% |
| Real estate — segment profit (¥ million) | 165 | 164 | +0.2% |
| Other — revenue (¥ million) | 39 | 71 | −44.5% |
| Other — segment profit (¥ million) | −5 | −20 | loss narrowed |
| Total assets (¥ million) | 14,980 | 15,183 | −1.3% |
| Net assets (¥ million) | 1,382 | 1,435 | −3.7% |
| Equity ratio | 9.2% | 9.5% | −0.3 pt |
| FY3/2027 guidance — revenue (¥ million) | 3,200 | — | +10.7% |
| FY3/2027 guidance — operating profit (¥ million) | 280 | — | n.m. |
| FY3/2027 guidance — ordinary profit (¥ million) | 110 | — | n.m. |
| FY3/2027 guidance — net profit (¥ million) | 210 | — | n.m. |
JapanStockPulse provides informational content only and does not constitute investment advice. Figures are taken from the company's published earnings short report and may be subject to subsequent revision.