Costs squeeze the margin
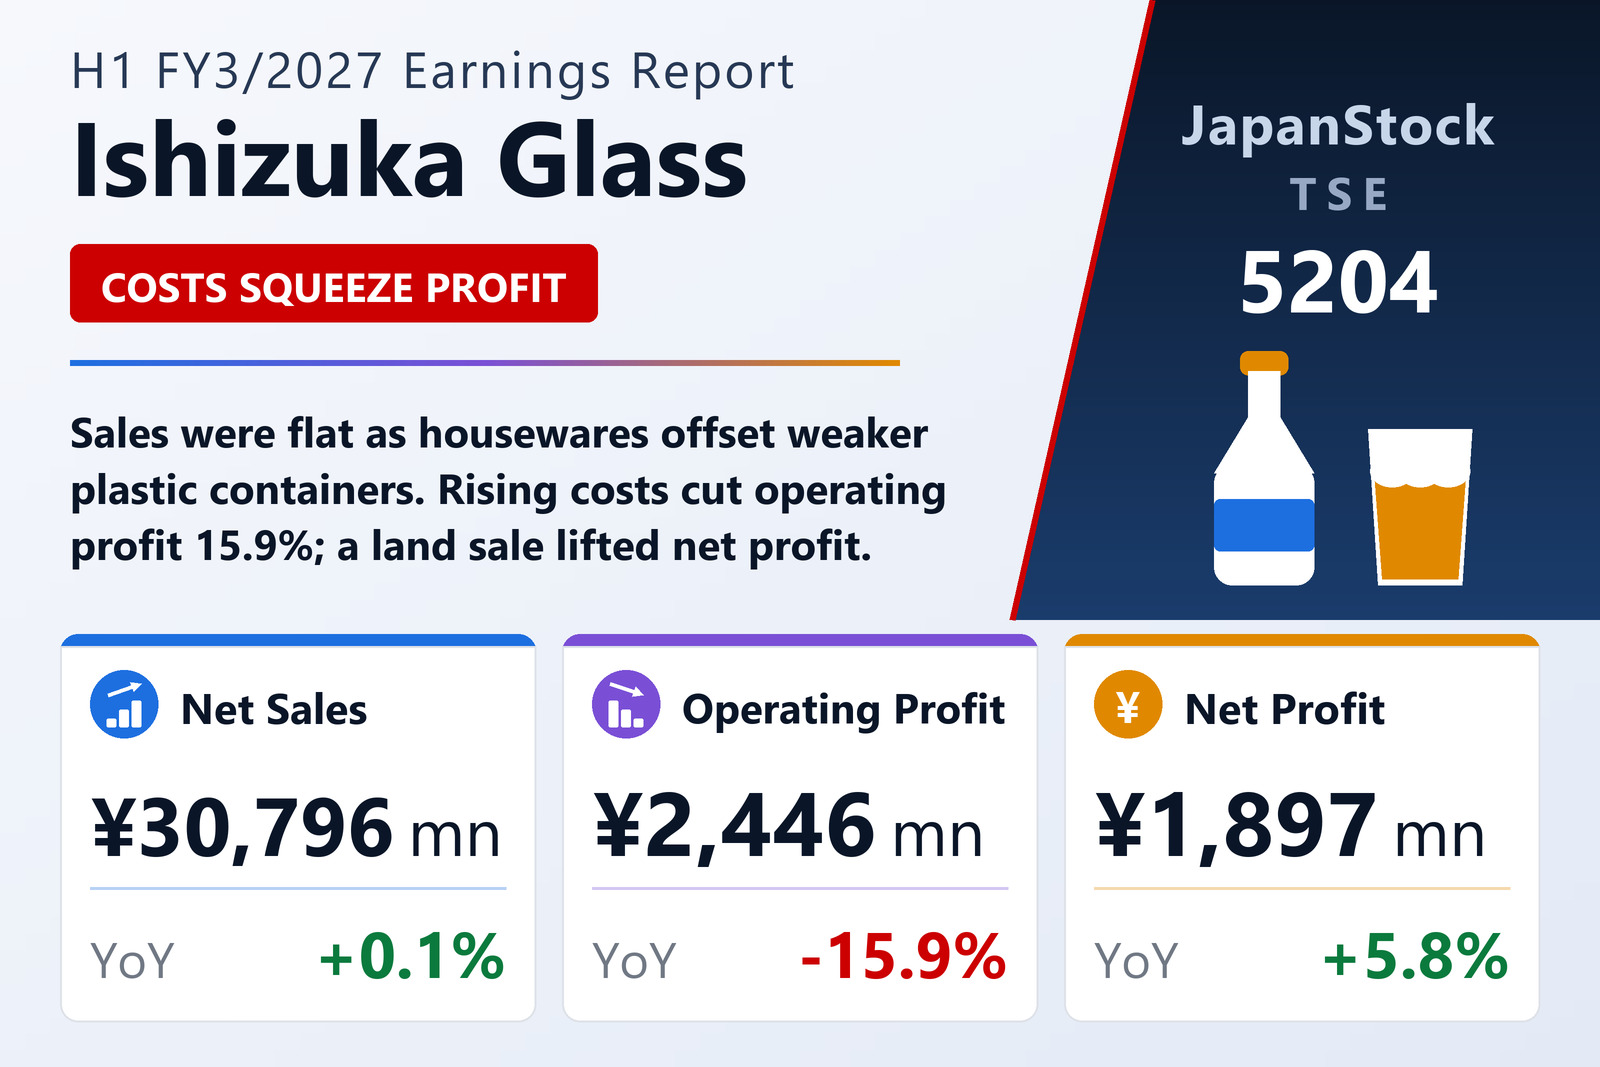
Ishizuka Glass Co., Ltd. (TSE: 5204) reported consolidated results for the first half of FY3/2027, from March 21 to September 20, 2026, on October 22, 2026 under Japanese GAAP. Net sales edged up 0.1% to ¥30,796 million, while operating profit fell 15.9% to ¥2,446 million and ordinary profit 4.8% to ¥2,506 million as costs rose across its operations. A gain on the sale of idle land lifted net profit attributable to owners of the parent 5.8% to ¥1,897 million, or ¥454.38 per share against ¥427.80.
Packaging and housewares
Glass bottle sales fell 1.4% to ¥5,364 million as consumers held back on purchases amid high prices, and the business's profit dropped 44.0% to ¥263 million. Paper container sales rose 2.0% to ¥4,829 million on steady volumes and price revisions. Sales of plastic containers, mainly preforms for PET bottles, fell 5.4% to ¥8,639 million as a long spell of unsettled weather cut orders and unit prices were reviewed in line with costs; their profit fell 5.3% to ¥1,189 million, still the largest in the group.
Housewares sales rose 5.4% to ¥6,937 million on corporate premium orders for glass tableware and higher domestic and overseas ceramics sales, although segment profit fell 19.9% to ¥305 million. Industrial materials sales fell 5.5% to ¥2,131 million as price increases on antibacterial agents cut volumes and the product mix of glass top plates for cooking appliances shifted. The other segment, led by pouch-drink filling, grew sales 10.2% to ¥2,893 million.
Balance sheet
Total assets rose by ¥3,073 million from March 20 to ¥103,068 million on higher cash and receivables. Net assets increased by ¥3,041 million to ¥42,333 million on retained earnings and higher valuation gains on securities, lifting the equity ratio to 39.5% from 37.8%. Cash and equivalents rose by ¥1,330 million to ¥4,274 million.
Outlook and dividend
The full-year forecast was left unchanged: net sales of ¥62,000 million (+4.2%), operating profit of ¥3,500 million (−15.9%), ordinary profit of ¥3,200 million (−17.6%) and net profit of ¥2,150 million (−17.9%), or ¥514.90 per share. The company plans a year-end dividend of ¥72, up from ¥70. Its medium-term plan targets consolidated operating profit of ¥5,000 million in fiscal 2027, the plan's final year.
| Metric | H1 FY3/2027 | H1 FY3/2026 | Change |
|---|---|---|---|
| Net sales (¥ million) | 30,796 | 30,769 | +0.1% |
| Operating profit (¥ million) | 2,446 | 2,909 | −15.9% |
| Ordinary profit (¥ million) | 2,506 | 2,633 | −4.8% |
| Net profit attrib. to owners of parent (¥ million) | 1,897 | 1,792 | +5.8% |
| EPS (¥) | 454.38 | 427.80 | +6.2% |
| Comprehensive income (¥ million) | 3,276 | 2,111 | +55.1% |
| Glass bottles — revenue (¥ million) | 5,364 | 5,442 | −1.4% |
| Glass bottles — segment profit (¥ million) | 263 | 470 | −44.0% |
| Paper containers — revenue (¥ million) | 4,829 | 4,734 | +2.0% |
| Paper containers — segment profit (¥ million) | 280 | 293 | −4.4% |
| Plastic containers — revenue (¥ million) | 8,639 | 9,128 | −5.4% |
| Plastic containers — segment profit (¥ million) | 1,189 | 1,255 | −5.3% |
| Housewares — revenue (¥ million) | 6,937 | 6,581 | +5.4% |
| Housewares — segment profit (¥ million) | 305 | 381 | −19.9% |
| Industrial materials — revenue (¥ million) | 2,131 | 2,256 | −5.5% |
| Industrial materials — segment profit (¥ million) | 382 | 452 | −15.5% |
| Other — revenue (¥ million) | 2,893 | 2,626 | +10.2% |
| Other — segment profit (¥ million) | 25 | 56 | −55.4% |
| Total assets (¥ million) | 103,068 | 99,995 | +3.1% |
| Net assets (¥ million) | 42,333 | 39,292 | +7.7% |
| Equity ratio | 39.5% | 37.8% | +1.7 pt |
| FY3/2027 guidance — revenue (¥ million) | 62,000 | — | +4.2% |
| FY3/2027 guidance — operating profit (¥ million) | 3,500 | — | −15.9% |
| FY3/2027 guidance — ordinary profit (¥ million) | 3,200 | — | −17.6% |
| FY3/2027 guidance — net profit (¥ million) | 2,150 | — | −17.9% |
| Annual dividend per share (¥) | 72.00 | 70.00 | +2.9% |
JapanStockPulse provides informational content only and does not constitute investment advice. Figures are taken from the company's published earnings short report and may be subject to subsequent revision.