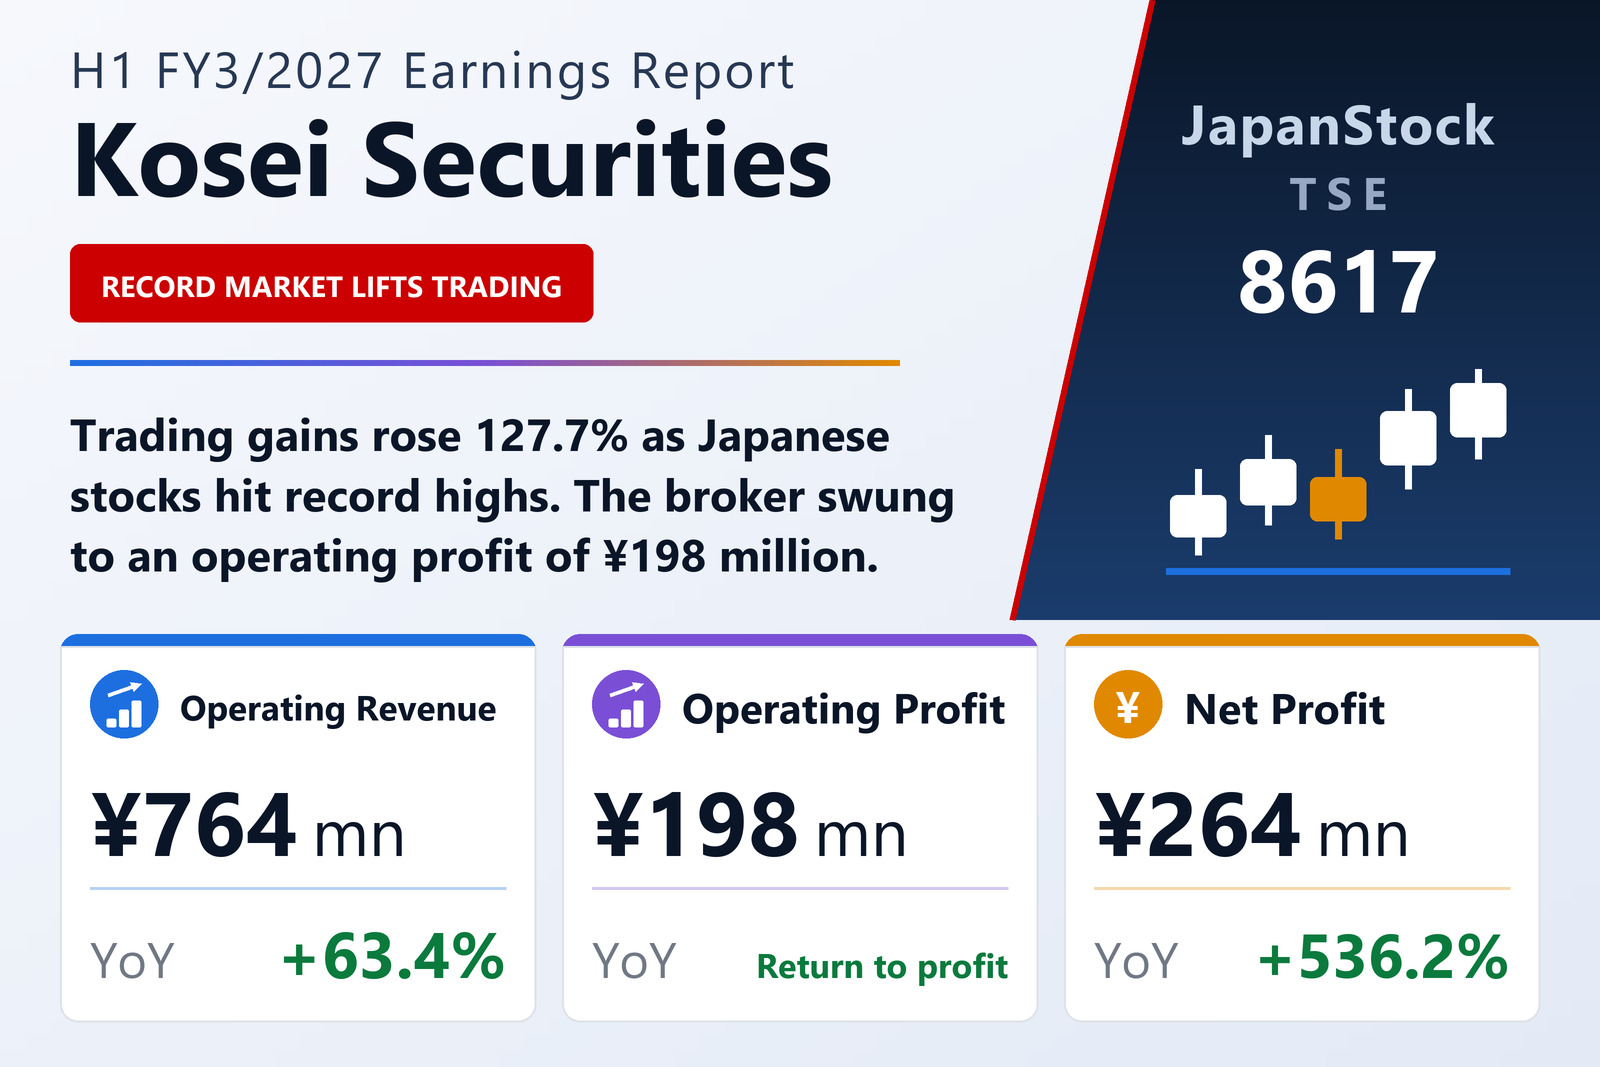
Dealing thrives in a record market
Kosei Securities Co., Ltd. (TSE: 8617) reported non-consolidated results for the first half of FY3/2027, from April 1 to September 30, 2026, on October 22, 2026 under Japanese GAAP. Operating revenue rose 63.4% to ¥764 million and net operating revenue 69.3% to ¥744 million. The company posted operating profit of ¥198 million against a loss of ¥48 million a year earlier, ordinary profit rose to ¥313 million from ¥50 million and net profit to ¥264 million from ¥41 million, or ¥28.05 per share against ¥4.40.
Japanese equities set record highs during the period, led by semiconductor, data-center and AI-related stocks. The Nikkei Stock Average climbed from the 50,000 range in April to the 72,000 range in June on hopes of progress in U.S.-Iran talks to end the war, before a renewed flare-up in the Middle East conflict capped gains and left it in the 66,000 range at the end of September. Dealing performed well and valuation gains on securities held increased, lifting trading gains 127.7% to ¥488 million. More customer trading raised commissions 36.7% to ¥153 million, while financial revenue fell 20.6% to ¥51 million and other operating revenue, mainly from providing core systems to other brokerages, was ¥70 million. Selling, general and administrative expenses rose 11.9% to ¥546 million.
Balance sheet
Total assets rose by ¥1,159 million from March 31 to ¥23,496 million, mainly on higher trading products and a revaluation of investment securities. Liabilities increased by ¥461 million to ¥6,534 million, chiefly on margin-trading liabilities. Net assets rose by ¥698 million to ¥16,962 million, mostly on higher valuation differences, and the equity ratio was 72.2%, against 72.8%. Cash and equivalents fell by ¥1,899 million to ¥2,066 million, largely because trading products increased.
No forecast
Kosei Securities does not publish an earnings forecast, saying results in the securities business depend heavily on economic and market conditions. Its dividend forecast for FY3/2027 is undecided; it paid a year-end dividend of ¥10 for FY3/2026.
| Metric | H1 FY3/2027 | H1 FY3/2026 | Change |
|---|---|---|---|
| Commissions received (¥ million) | 153 | 112 | +36.7% |
| Trading gains (¥ million) | 488 | 214 | +127.7% |
| Financial revenue (¥ million) | 51 | 64 | −20.6% |
| Operating revenue (¥ million) | 764 | 467 | +63.4% |
| Net revenue (¥ million) | 744 | 439 | +69.3% |
| SG&A expenses (¥ million) | 546 | 488 | +11.9% |
| Operating profit (¥ million) | 198 | −48 | loss to profit |
| Ordinary profit (¥ million) | 313 | 50 | +519.4% |
| Net profit (¥ million) | 264 | 41 | +536.2% |
| EPS (¥) | 28.05 | 4.40 | +537.5% |
| Total assets (¥ million) | 23,496 | 22,336 | +5.2% |
| Net assets (¥ million) | 16,962 | 16,263 | +4.3% |
| Equity ratio | 72.2% | 72.8% | −0.6 pt |
JapanStockPulse provides informational content only and does not constitute investment advice. Figures are taken from the company's published earnings short report and may be subject to subsequent revision.