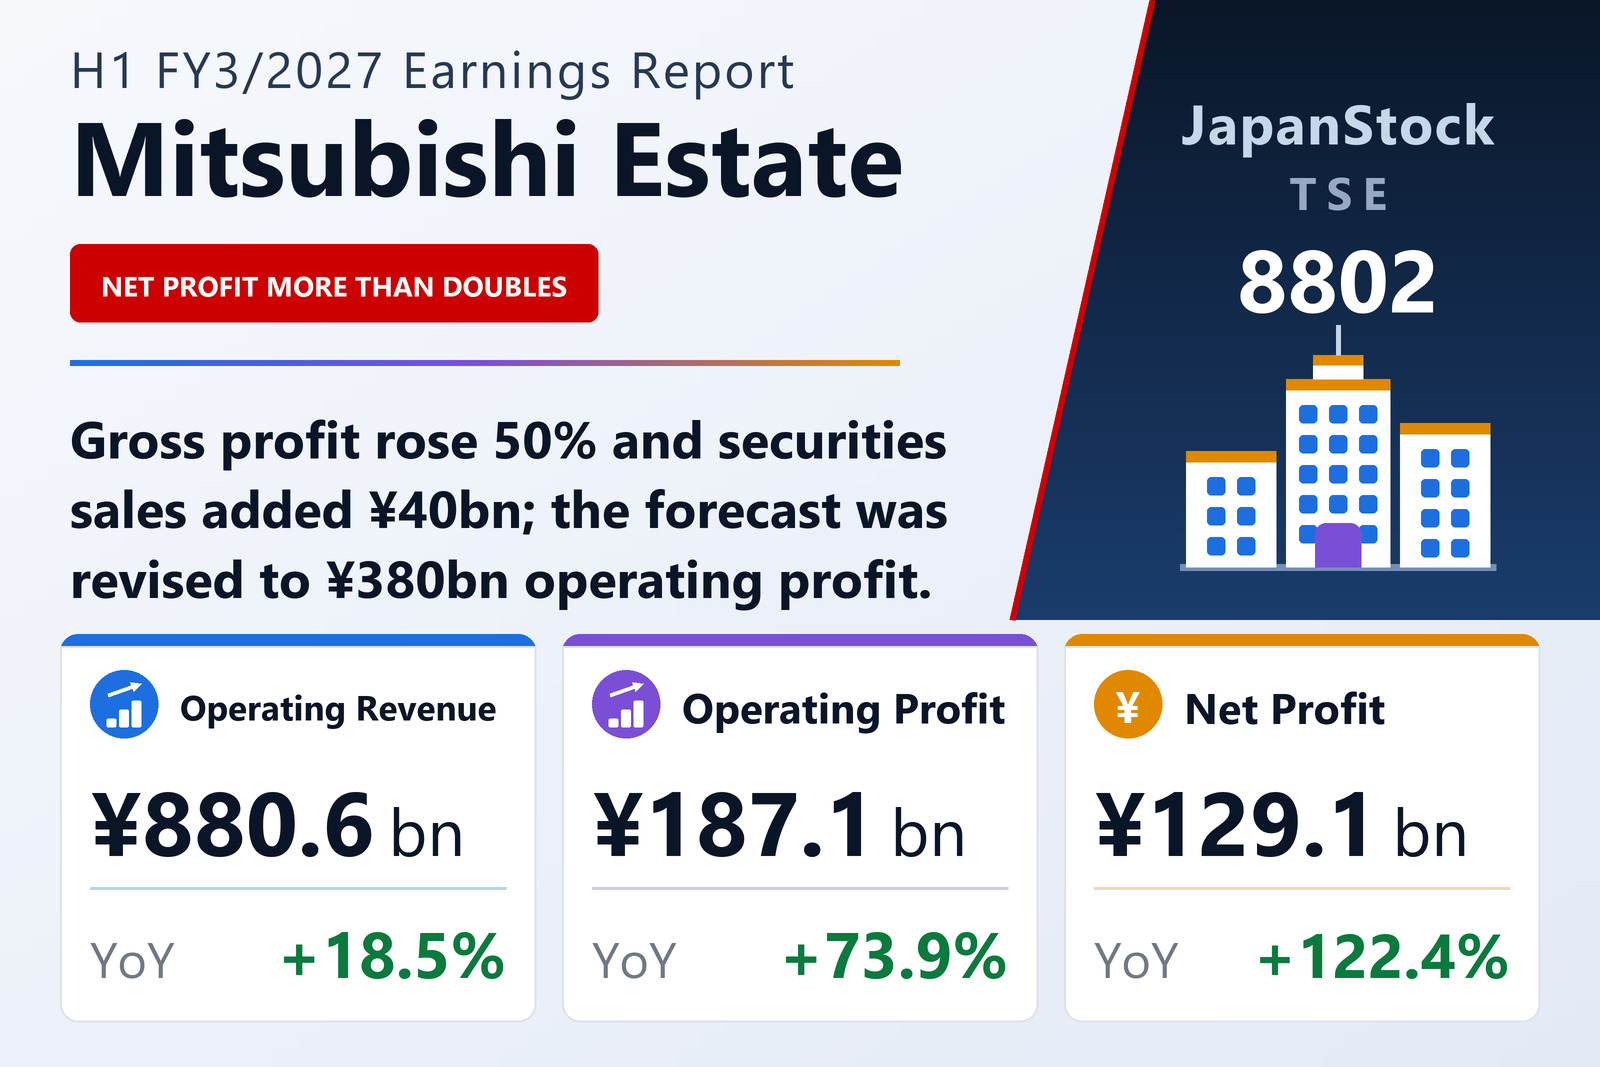
Gross profit up 50%
Mitsubishi Estate Co., Ltd. (TSE: 8802) reported consolidated results for the first half of FY3/2027, April 1 to September 30, 2026, on November 9, 2026. The company did not include a narrative review of operations in its earnings summary, referring readers to its supplementary materials and semiannual report, so the figures here come from its financial statements. Operating revenue rose by ¥137.4 billion while operating costs rose 9.3% to ¥631,835 million, lifting gross profit 50.5% to ¥248,778 million; selling, general and administrative expenses rose 6.8% to ¥61,652 million.
Interest expense rose to ¥31,692 million from ¥25,058 million, so ordinary profit grew 88.9% to ¥156,140 million. Extraordinary gains of ¥40,100 million, all from selling investment securities, compared with ¥25,992 million a year earlier, when the company also booked ¥11,772 million of losses related to retiring fixed assets. Total assets rose 1.6% to ¥8,699,729 million and equity investments increased to ¥1,225,317 million from ¥1,121,300 million; the equity ratio was 31.6%. After the period, Mitsubishi Estate decided on November 9 to cancel 12,912,800 treasury shares on November 30, 2026.
Forecast revised
Mitsubishi Estate revised its FY3/2027 forecast to operating revenue of ¥2,000,000 million (+14.5%), operating profit of ¥380,000 million (+15.2%), ordinary profit of ¥305,000 million (+11.7%) and net profit attributable to owners of ¥245,000 million (+10.1%). The first half has delivered 49.2% of the operating profit target. It paid an interim dividend of ¥24 and kept its annual forecast of ¥49, up from ¥46.
| Metric | H1 FY3/2027 | H1 FY3/2026 | Change |
|---|---|---|---|
| Operating revenue (¥ million) | 880,614 | 743,204 | +18.5% |
| Gross profit (¥ million) | 248,778 | 165,306 | +50.5% |
| Operating profit (¥ million) | 187,126 | 107,590 | +73.9% |
| Ordinary profit (¥ million) | 156,140 | 82,645 | +88.9% |
| Net profit attrib. to owners of parent (¥ million) | 129,133 | 58,071 | +122.4% |
| Comprehensive income (¥ million) | 152,859 | 32,123 | +375.8% |
| EPS (¥) | 107.40 | 47.03 | +128.4% |
| Total assets (¥ million) | 8,699,729 | 8,566,247 | +1.6% |
| Net assets (¥ million) | 2,949,706 | 2,877,585 | +2.5% |
| Equity ratio | 31.6% | 31.4% | +0.2 pt |
| FY3/2027 guidance — operating revenue (¥ million) | 2,000,000 | — | +14.5% |
| FY3/2027 guidance — operating profit (¥ million) | 380,000 | — | +15.2% |
| FY3/2027 guidance — ordinary profit (¥ million) | 305,000 | — | +11.7% |
| FY3/2027 guidance — net profit (¥ million) | 245,000 | — | +10.1% |
| Annual dividend per share (¥) | 49.00 | 46.00 | +6.5% |
JapanStockPulse provides informational content only and does not constitute investment advice. Figures are taken from the company's published earnings short report and may be subject to subsequent revision.