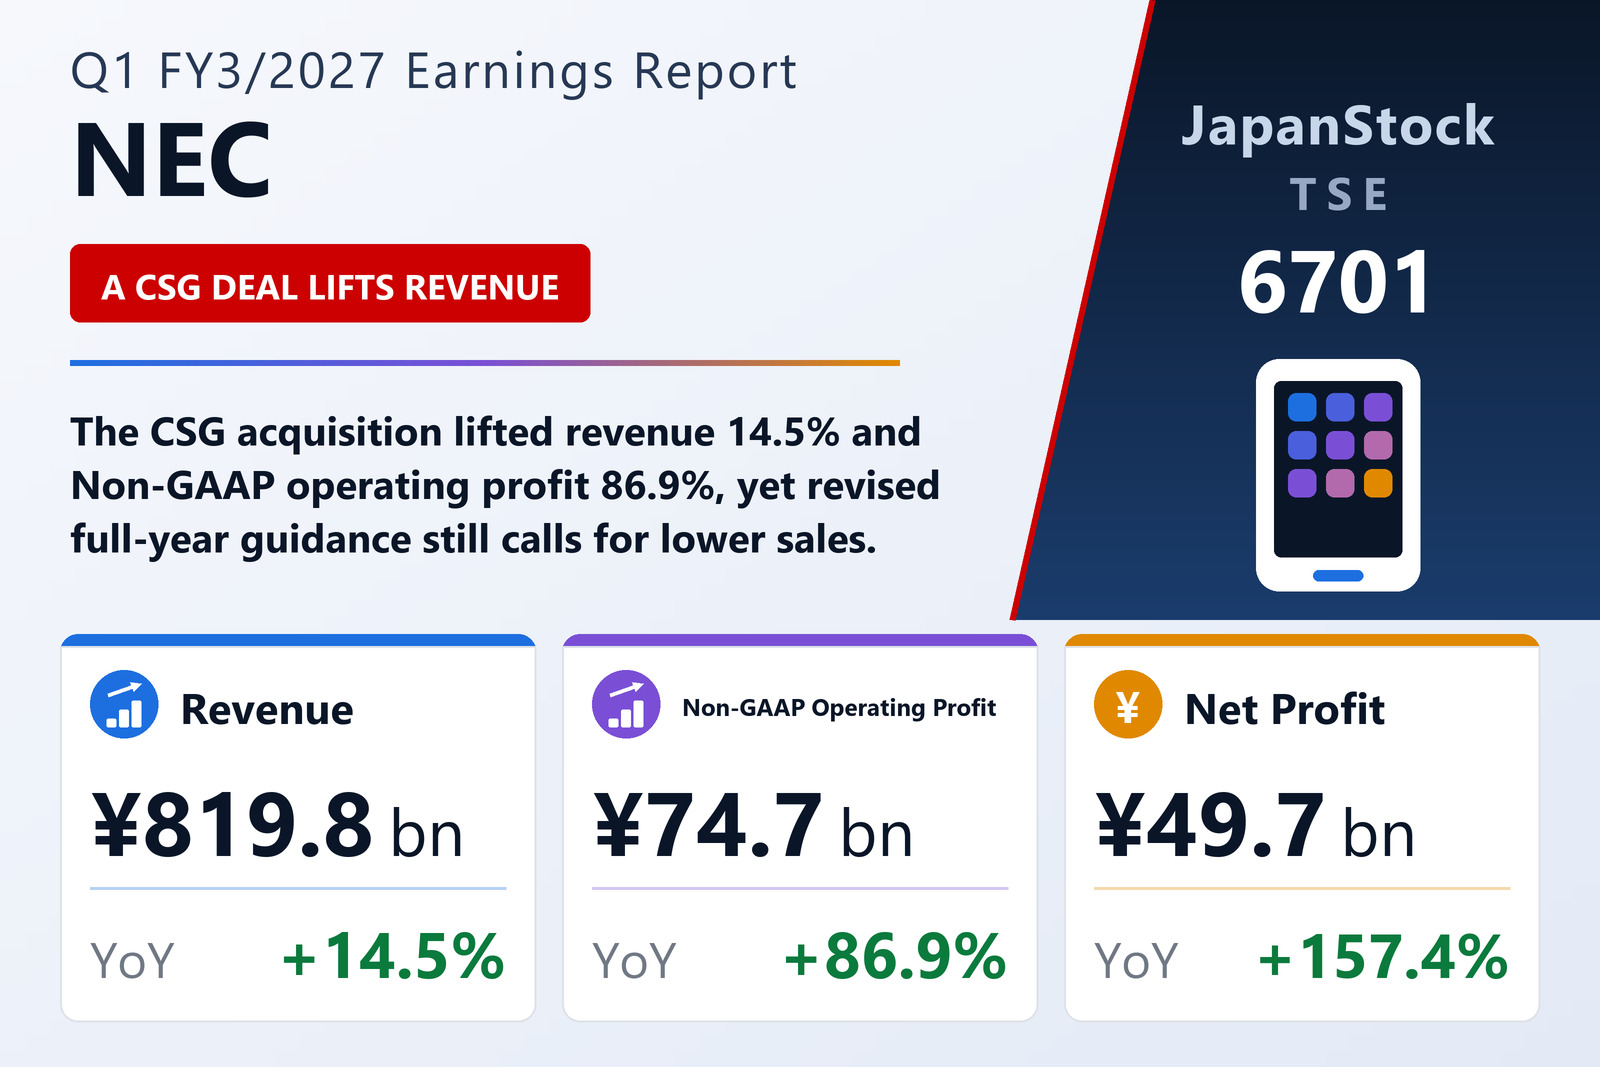
NEC Corporation (TSE: 6701), the Tokyo-based IT services and network-infrastructure group, reported consolidated results for the first quarter of the fiscal year ending March 2027 — the three months from April 1 to June 30, 2026 — under IFRS. Revenue rose 14.5% to ¥819,774 million, operating profit jumped 66.1% to ¥58,770 million, profit before tax climbed 76.1% to ¥56,529 million, and profit attributable to owners of the parent surged 157.4% to ¥49,698 million. Basic and diluted earnings per share were both ¥37.47, up from ¥14.49 a year earlier.
Profit outran revenue on every line
Growth was concentrated in the profit lines rather than the top line. Gross profit rose to ¥268,363 million from ¥216,188 million, comfortably outpacing a rise in selling, general and administrative expenses to ¥208,359 million from ¥183,681 million; other income and expenses swung to a loss of ¥1,234 million from a gain of ¥2,882 million. Quarterly profit rose 156.9% to ¥49,977 million and comprehensive income increased 44.2% to ¥67,639 million, from ¥46,905 million. On the company's own Non-GAAP basis — operating profit before amortisation of intangibles recognised on acquisitions, M&A-related costs, restructuring costs, impairment losses, share-based compensation and other one-time items — operating profit rose 86.9% to ¥74,738 million from ¥39,995 million, Non-GAAP profit attributable to owners rose 173.2% to ¥60,880 million from ¥22,281 million, and Non-GAAP earnings per share reached ¥45.90 from ¥16.72. The gap between the two operating-profit measures widened to ¥15,968 million from ¥4,606 million, driven mainly by M&A-related costs of ¥7,472 million (against just ¥1 million a year earlier) and ¥5,750 million of acquisition-intangible amortisation.
A new basis for segment disclosure
From this quarter NEC presents reportable-segment profit on a Non-GAAP operating profit basis. Previously the company total was disclosed on both an adjusted operating profit and a Non-GAAP operating profit basis while the reportable segments were shown on an adjusted operating profit basis only; both now use the single Non-GAAP measure. The segment line-up was also reorganised on April 1, 2026, moving domestic telecom-carrier IT services and Netcracker Technology Corporation out of Social Infrastructure and into IT Services, with prior-year figures restated on the same basis. On that restated footing, IT Services revenue including inter-segment sales rose 9.6% to ¥621,800 million and segment profit rose 41.6% to ¥57,803 million, while Social Infrastructure revenue rose 37.3% to ¥165,908 million and segment profit multiplied more than fivefold to ¥16,087 million from ¥3,046 million. Unallocated corporate costs — mainly advanced-technology research and development — narrowed to ¥1,690 million from ¥4,720 million. By region, external revenue in Japan rose 6.1% to ¥598,125 million while overseas revenue jumped 46.1% to ¥221,649 million from ¥151,665 million.
The CSG acquisition dominates the cash flow statement
The step-change in overseas revenue has a single main cause. On May 14, 2026 NEC completed the acquisition of 100% of CSG Systems International, Inc., a U.S. software company serving telecom and broadband operators, through a reverse triangular merger executed by its North American holding company NEC Corporation of America. Cash consideration was ¥360,841 million; the provisional fair value of identifiable net assets acquired was negative ¥32,849 million, producing goodwill of ¥393,690 million. Since the acquisition date CSG has contributed ¥32,761 million of revenue and a loss of ¥287 million; had the deal closed at the start of the fiscal year, group revenue for the quarter would have been ¥833,514 million and quarterly profit ¥39,787 million. Forty-seven companies were newly consolidated in the quarter, CSG and its subsidiaries among them, and ¥1,840 million of the ¥4,046 million of acquisition-related costs was charged to SG&A. The deal reshaped the cash flow statement: investing activities consumed ¥401,358 million, including ¥413,356 million for the acquisition of subsidiaries, while operating cash flow fell to ¥160,178 million from ¥253,065 million and financing activities provided ¥12,007 million, helped by ¥50,000 million of bond issuance. Cash and cash equivalents ended the quarter at ¥434,699 million, down ¥224,335 million from the year-end.
Goodwill nearly doubles, equity ratio edges up
Total assets stood at ¥4,506,827 million at June 30, against ¥4,466,784 million at the March 2026 year-end — a modest headline change that conceals a substantial reshuffle. Goodwill nearly doubled to ¥855,129 million from ¥450,501 million, lifting non-current assets to ¥2,491,011 million from ¥2,007,691 million, while current assets fell to ¥2,015,816 million from ¥2,459,093 million as the March-end receivable balance was collected (trade and other receivables dropped to ¥565,529 million from ¥994,066 million) and cash was deployed into the acquisition. Total equity rose to ¥2,319,715 million from ¥2,281,887 million and equity attributable to owners of the parent to ¥2,234,070 million from ¥2,196,578 million, nudging the equity ratio to 49.6% from 49.2%.
Guidance revised, yet full-year revenue is still set to fall
NEC revised its full-year forecast alongside the results. The company guides on a Non-GAAP basis only — there is no IFRS operating profit forecast line — and now expects revenue of ¥3,540,000 million, down 1.2%, Non-GAAP operating profit of ¥430,000 million, up 8.2%, Non-GAAP profit attributable to owners of ¥290,000 million, up 3.7%, and Non-GAAP earnings per share of ¥218.65. The combination is unusual after a quarter this strong: management is effectively guiding to margin expansion on a shrinking top line. It also implies a heavily back-loaded year — first-quarter Non-GAAP operating profit of ¥74,738 million is only about 17% of the ¥430,000 million annual plan, which is normal for NEC's fourth-quarter-weighted mix but leaves most of the target still to earn. The dividend forecast is unchanged from the previous announcement at an interim of ¥20.00 and a year-end of ¥20.00 for an annual ¥40.00 per share, above the ¥38.00 paid for the year ended March 2026 (¥16.00 interim plus ¥22.00 year-end). Amendments to IFRS 9 and IFRS 7 were adopted from this quarter with no material effect, no material subsequent events were reported, and the quarterly consolidated statements were not subject to review by a certified public accountant or auditing firm.
| Metric | Q1 FY3/2027 | Q1 FY3/2026 | YoY |
|---|---|---|---|
| Revenue (¥ billion) | 819.77 | 715.66 | +14.5% |
| Operating profit — IFRS (¥ billion) | 58.77 | 35.39 | +66.1% |
| Non-GAAP operating profit (¥ billion) | 74.74 | 40.00 | +86.9% |
| Profit before tax (¥ billion) | 56.53 | 32.10 | +76.1% |
| Profit attrib. to owners — IFRS (¥ billion) | 49.70 | 19.31 | +157.4% |
| Non-GAAP profit attrib. to owners (¥ billion) | 60.88 | 22.28 | +173.2% |
| Comprehensive income (¥ billion) | 67.64 | 46.91 | +44.2% |
| Basic EPS — IFRS (¥) | 37.47 | 14.49 | +158.6% |
| Non-GAAP EPS (¥) | 45.90 | 16.72 | +174.5% |
| Equity ratio (%, vs FY3/26 year-end) | 49.6 | 49.2 | +0.4 pt |
| Annual dividend (¥, FY3/27 forecast vs FY3/26 actual) | 40.00 | 38.00 | +2.00 |
JapanStockPulse provides informational content only and does not constitute investment advice. Figures are taken from the company's published earnings short report and may be subject to subsequent revision.